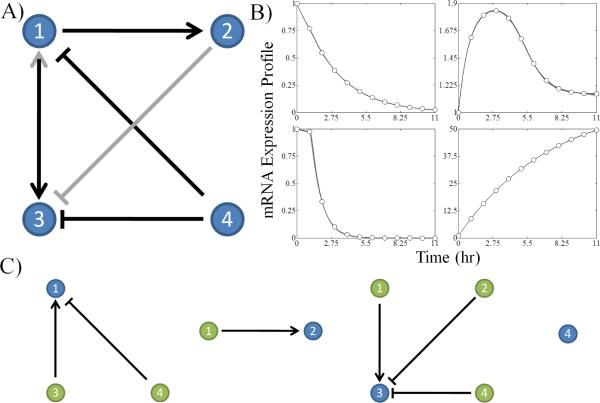
Fig. 1.
Example network results generated by the algorithm for a network of 4 genes. A) The consensus network is presented with black arrows signifying edges present in the original test network and gray edges representing false positives generated by the algorithm. The → means activation and the ⊣ means inhibition. B) The mRNA expression profiles of the subnetworks are compared with the data obtained from the test network. The gray lines are the sets of optimal subnetwork expression profiles from the ensemble of candidate subnetworks. The individual subnetworks are not necessarily identical despite their respective mRNA expression profiles being experimentally indistinguishable. C) Isolated subnetworks associated with the network decomposition are shown with the target gene displayed in blue and the regulatory genes displayed in green.

