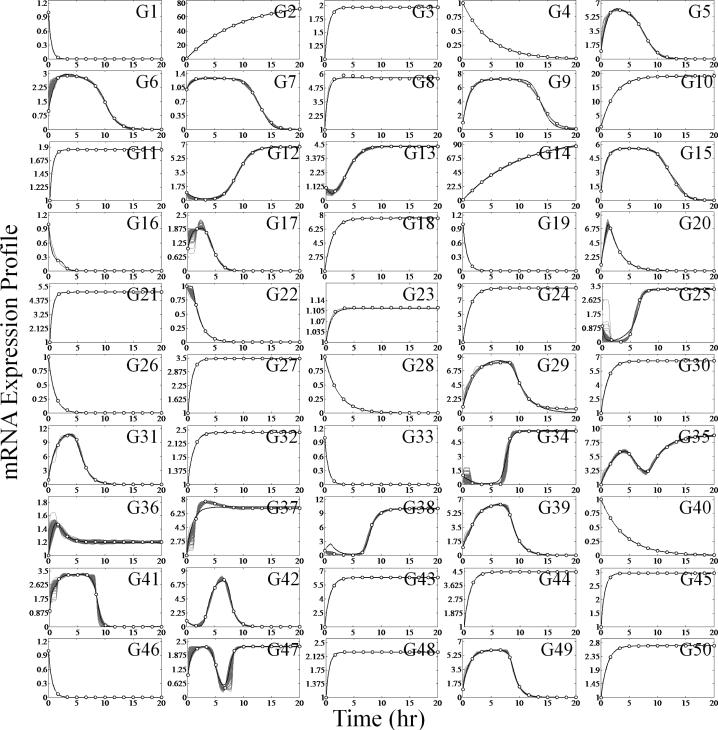
Fig. 4.
Example network mRNA expression profile dynamics simulated using the consensus network topology for a network of 50 genes. The optimal parameter set was obtained using a simple gradient-based search with the initial starting point obtained from the optimal subnetwork parameter results. The gray lines correspond to the optimal subnetwork expression profiles while the black lines represents the optimal ensemble network expression profiles. Note that many of the subnetwork expression profiles are hidden by their respective network expression profile.

