Fig. 7.
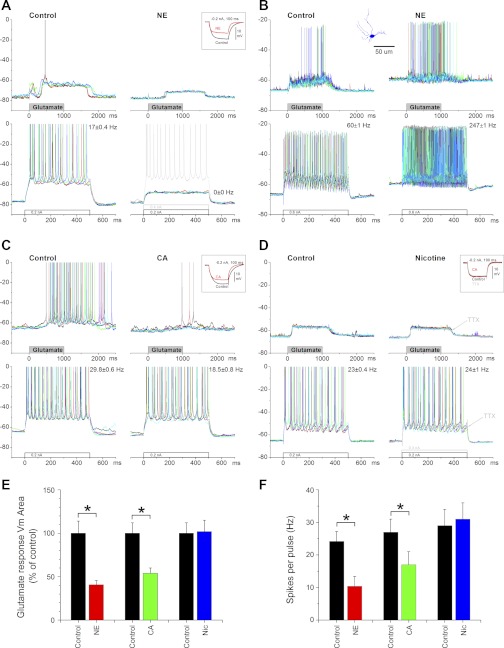
Effects of neuromodulators on responses evoked by glutamate pulses. A–D: examples of responses to the same glutamate iontophoretic pulses (1,000 ms) and to the same positive intracellular current pulses (500 ms) before and during NE (A and B), CA (C), or nicotine (D). Each panel overlays 5 trials. Insets in A, C, and D show negative current pulse used to monitor Rin. Also depicted is the mean ± SE firing rate evoked by the intracellular current pulse during control and during neuromodulation. Inset in B shows the recorded cell reconstructed. D overlays gray traces after application of TTX (1 μM). E: population data showing the Vm area measured from baseline and triggered by the glutamate pulses before and during NE, CA, or nicotine. F: population data for the cells in E, showing the number of spikes triggered by the intracellular current pulse before and during NE, CA, or nicotine. *P < 0.01.

