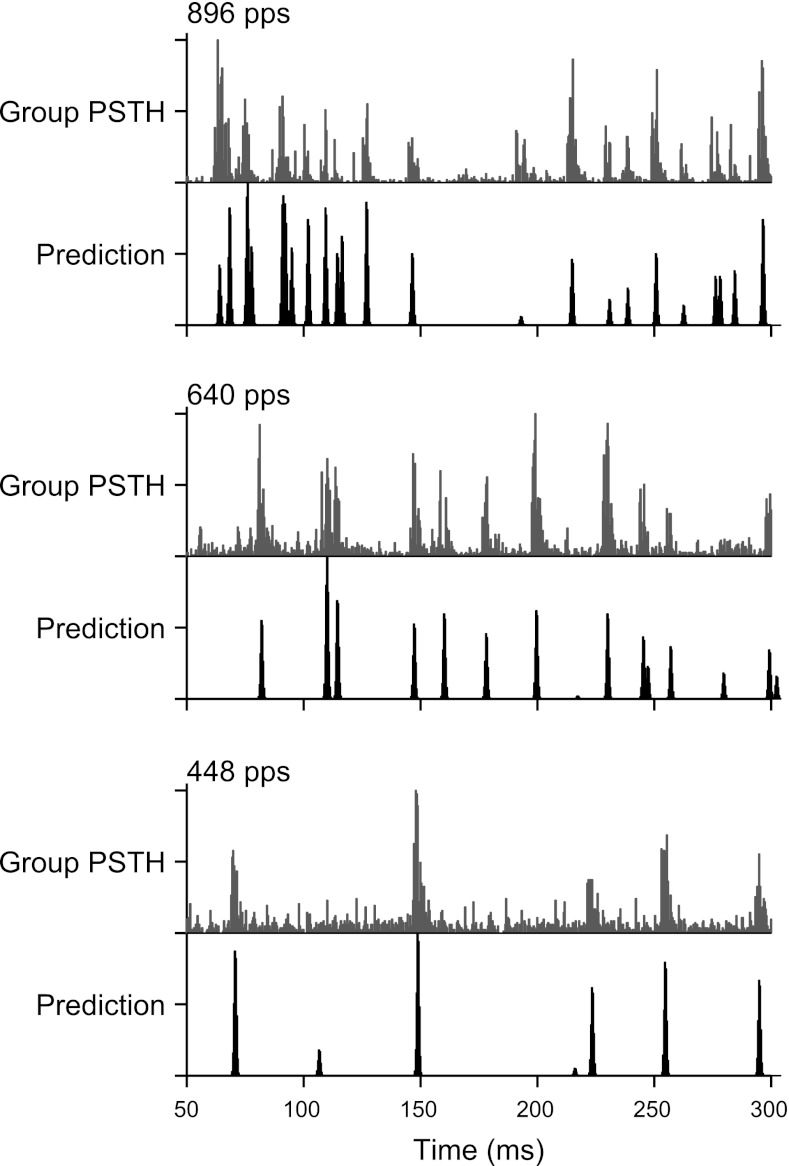
Fig. 13.
Short interpulse intervals predicted the pooled responses to high-rate jittered pulse trains. Gray, subset of pooled PSTHs from Fig. 9; black, predicted PSTHs generated as in Fig. 12, B and C, using a threshold of four times the mean pulse rate. Peaks in the measured PSTHs occurred at times well predicted by the shortest interpulse intervals.

