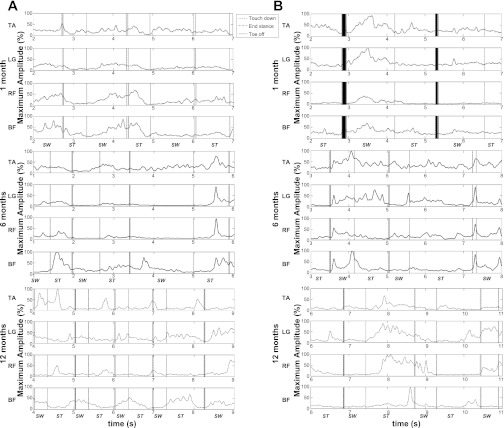
Fig. 4.
Smoothed, rectified electromyograms (EMG) from 2 infants. A: EMG traces from an infant who produced alternating steps consistently at all ages. B: EMG traces from an infant who took fewer consecutive, alternating steps at 1 and 6 mo. Y-axis values represent the percentage of maximal amplitude for that muscle. Maximum amplitude was identified for each infant, at each test session for each muscle, as the highest peak value across all steps produced by that infant. ST, stance phase; SW, swing phase.

