Fig. 5.
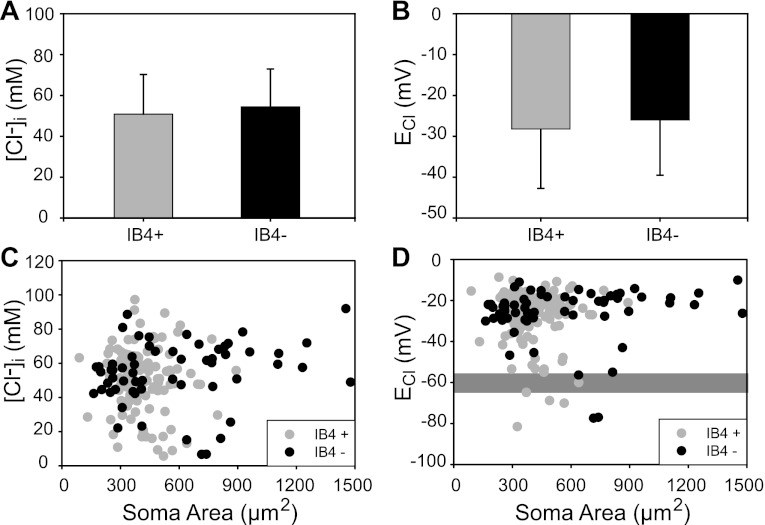
Intracellular [Cl−] and ECl are independent of DRG cell phenotype. A: basal [Cl−]i in IB4+ and IB4− DRG neurons. Average basal [Cl−]i was 51 ± 19 mM (n = 117 cells; mean ± SD) in IB4+ neurons and 54 ± 18 mM (n = 59 cells) in IB4− neurons. The difference between means was not significant (P = 0.27). B: ECl in IB4+ (−28 ± 13 mV) and IB4− (−26 ± 13 mV) cells (mean ± SD). The difference between means was not significant (P = 0.44). C: scatterplot of [Cl−]i and soma area in IB4+ and IB4− DRG neurons. There was no correlation between [Cl−]i and soma area (r = 0.06). D: scatterplot of ECl and soma area in IB4+ and IB4− DRG neurons. The gray shaded rectangular area represents the reported average range of resting membrane potential (Em; −55 to −65 mV). ECl was less negative than Em in most cells (95.5%); ECl was equal to Em in ∼2% of the cells; and ECl was more negative than Em in only ∼3% of the cells. (HEPES-buffered solutions, [Cl−]o = 131 mM; error bars in A and B represent SD).

