Fig. 5.
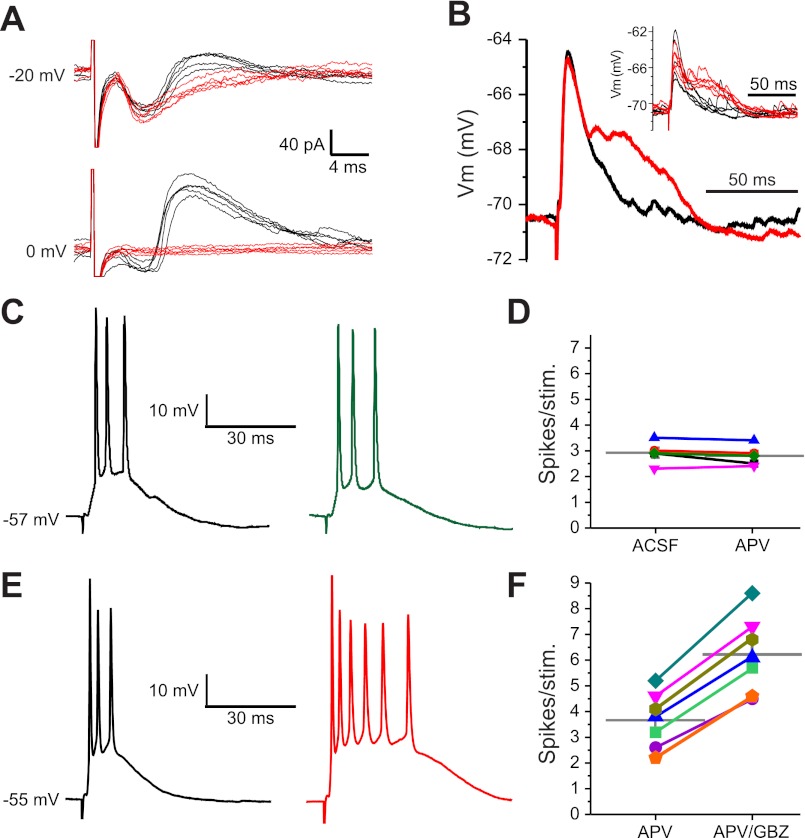
Intraglomerular inhibition of ETCs. A: ETC responses to ON stimulation held at −20 or 0 mV in aCSF (black traces) or GBZ (red traces). ETCs held at −20 mV responded to suprathreshold ON stimulation with a short-latency EPSC (downward deflection) followed by an inhibitory current (upward deflection). ETCs held at 0 mV showed only the prominent upward-deflection IPSC. B: average of five excitatory postsynaptic potentials (EPSPs) in an ETC held at −70 mV after ON stimulation in aCSF (black trace) or GBZ (red trace). Vm, membrane voltage. Inset: individual sweeps. C: current-clamp recording in an ETC after ON stimulation in control (aCSF, black trace) and after the addition of 50 μM APV (green trace). D: plot of individual ETC spikes/stimulation in control and after the addition of APV. The gray horizontal bar shows the population mean. E: current-clamp recording in an ETC after ON stimulation in control (aCSF containing 50 μM APV, black trace) and after the addition of 100 μM GBZ (red trace). F: plot of individual ETC spikes/stimulation in control and after the addition of GBZ. The gray horizontal bars show population means.

