Fig. 7.
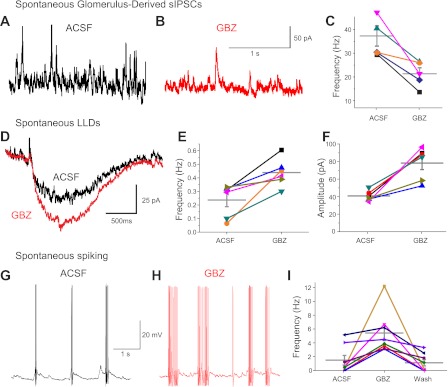
Tonic intraglomerular inhibition regulates spontaneous MC activity. A–C: glomerulus-derived spontaneous MC IPSCs. A: spontaneous (s)IPSCs in aCSF. B: glomerular injection of 100 μM GBZ reduced MC sIPSCs (Vh = −10 mV). C: plot of sIPSC frequency (in Hz) of individual MCs in aCSF and GBZ. The horizontal gray bars show population means. D–F: spontaneous MC LLDs. D: spontaneous LLD in aCSF (black trace, average of 21 spontaneous LLDs aligned to 50% rise time) and after intraglomerular injection of GBZ (red trace, average of 32 spontaneous LLDs aligned to 50% rise time). E and F: plot of spontaneous LLD frequency (in Hz) and amplitude in aCSF and GBZ. G–I: glomerular injection of GBZ increased spontaneous action potentials. G: spontaneous action potentials in aCSF. H: intraglomerular injection of GBZ increased the number of MC action potentials. I: plot of individual MC spike frequency in aCSF, in GBZ, and after the washout of GBZ. The gray horizontal bars show population means.

