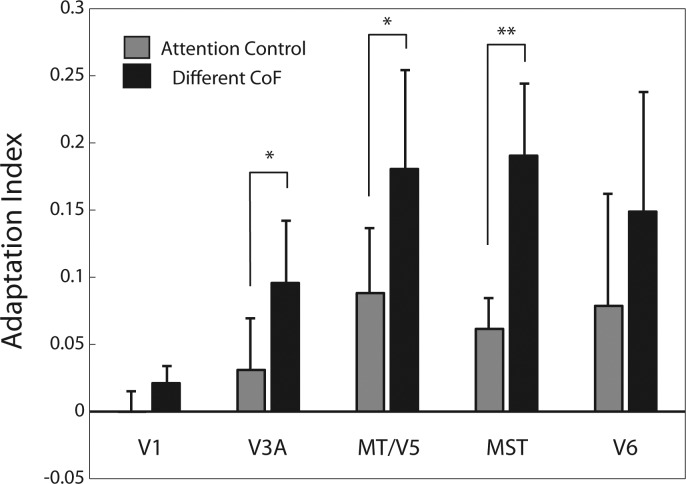
Fig. 4.
Adaptation indexes. Adaptation indexes for conditions “Different CoF” and “Attention Control” are shown separately for each ROI. Bars indicate the mean ± SE index across hemispheres. Asterisks indicate significant differences between conditions “Different CoF” and “Attention Control” (*P < 0.05, **P = 0.01).

