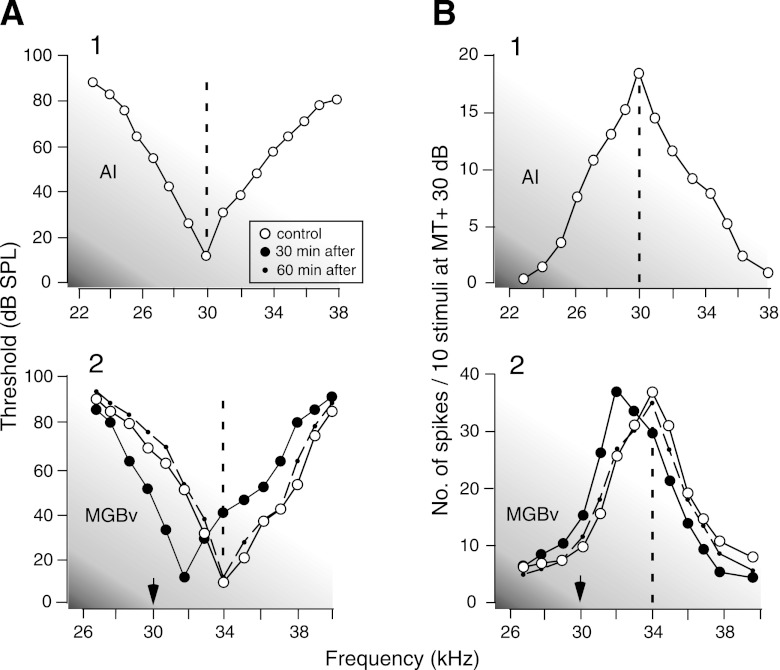
Fig. 3.
Changes in the frequency-threshold (A) and frequency-response (B) curves of a sharply tuned MGBv neuron evoked by cortical stimulation. The cortical stimulation (A1 and B1) laterally shifted the frequency-threshold (A2) and frequency-response (B2) curves of the MGBv neuron. MT, minimum threshold.

