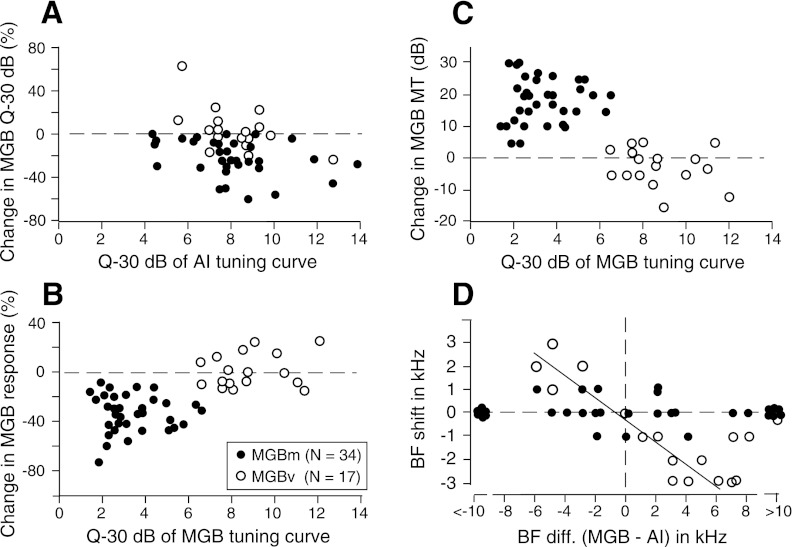
Fig. 5.
Changes in the sharpness (Q-30 dB) of the frequency-threshold curves (A), the response magnitudes (B), and the minimum thresholds (C) of thalamic neurons as a function of the sharpness of stimulated cortical (AI) or recorded thalamic (MGB) neurons and the BF shifts of the thalamic neurons as a function of the BF differences (diff.) between the recorded thalamic and stimulated cortical neurons (D). Changes in the response magnitude of the thalamic neurons were calculated with the total numbers of spikes discharged in a 10-kHz band with the BF of a given neuron at its center. Closed and open circles: the data obtained from the MGBm and MGBv neurons, respectively. In D, the regression line is for the open circles within ±6.0-kHz BF differences (r2=0.89).

