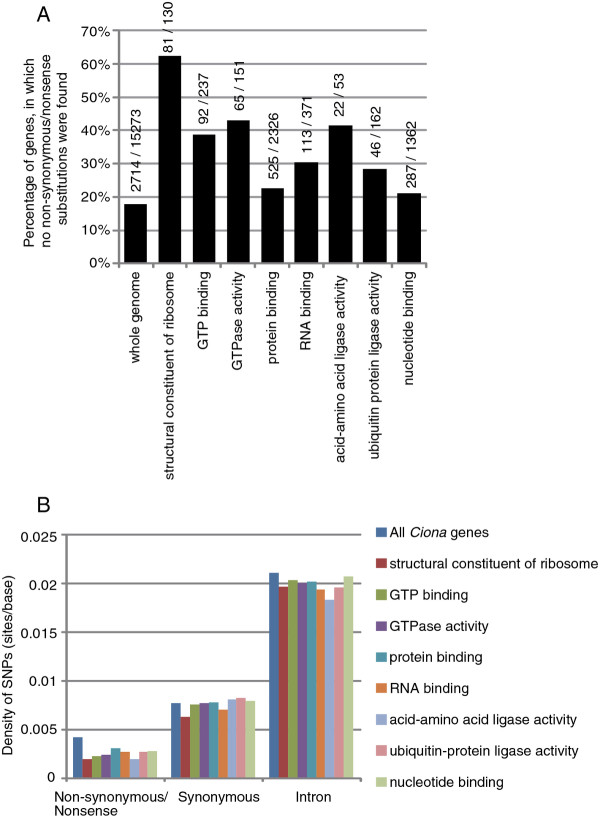
Figure 4 .
Function of genes with no non-synonymous and nonsense substitutions.(A) Functional GO categories overrepresented among genes with no non-synonymous/nonsense substitutions. The numbers above the bars indicate the number of genes with no non-synonymous/nonsense substitutions, and the number of total genes in each of the functional groups. (B) Density of non-synonymous/nonsense, synonymous and intronic SNPs within each of the functional groups.

