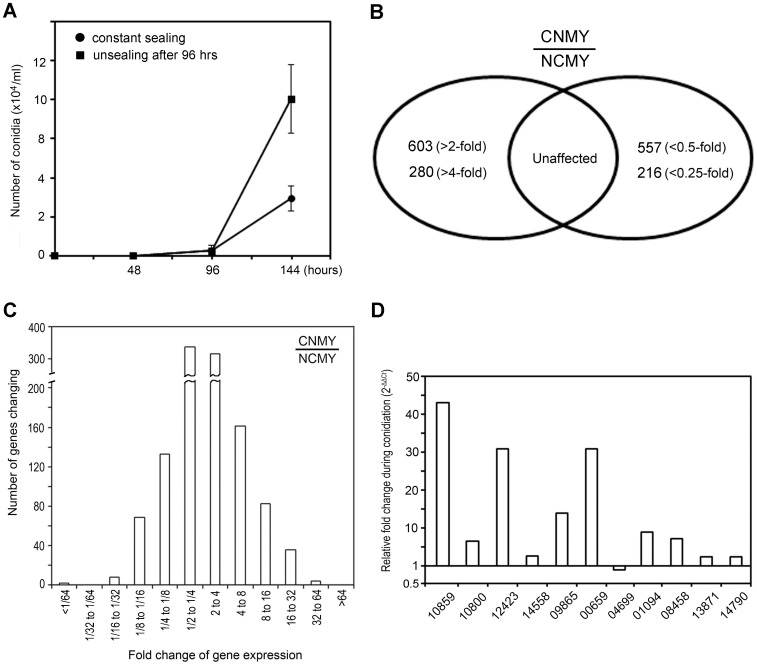
Figure 1. The genome-wide analysis of changes in mRNA abundance during conidiation.
(A). Measurement of the conidial density of M. oryzae on polycarbonate membrane-laid OMA plates at the indicated times. (B). The number of genes induced (left) or repressed (right) during conidiation based on the comparison of RNA levels of non-conidiating mycelia (NCMY) with conidiating mycelia (CNMY) of M. oryzae. (C). The number of genes induced (right) or repressed (left) with fold change values during conidiation of M. oryzae. (D). Validation of the microarray data by qRT-PCR. Transcript levels of each gene in CNMY were normalized to β-tubulin and expressed as relative values, with 1 corresponding to the NCMY. Each of five-digit number on the x-axis indicates the MGG locus number.

