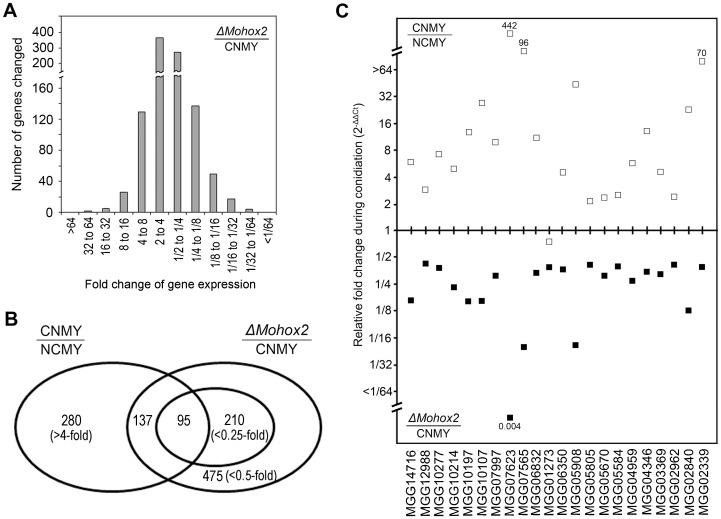
Figure 4. The genome-wide analysis of changes in mRNA abundance in the ΔMohox2 mutant during conidiation.
(A). The number of genes induced (left) or repressed (right) with fold change values by comparing RNA levels in wild type with those in the ΔMohox2 mutant during conidiation. (B). The number of genes induced in wild-type and repressed in the ΔMohox2 mutant during conidiation. (C). Validation of microarray data by qRT-PCR. Graph shows the transcript levels of each gene on the same x-axis in the wild-type (white squares) and in the ΔMohox2 mutant (black squares) during conidiation.

