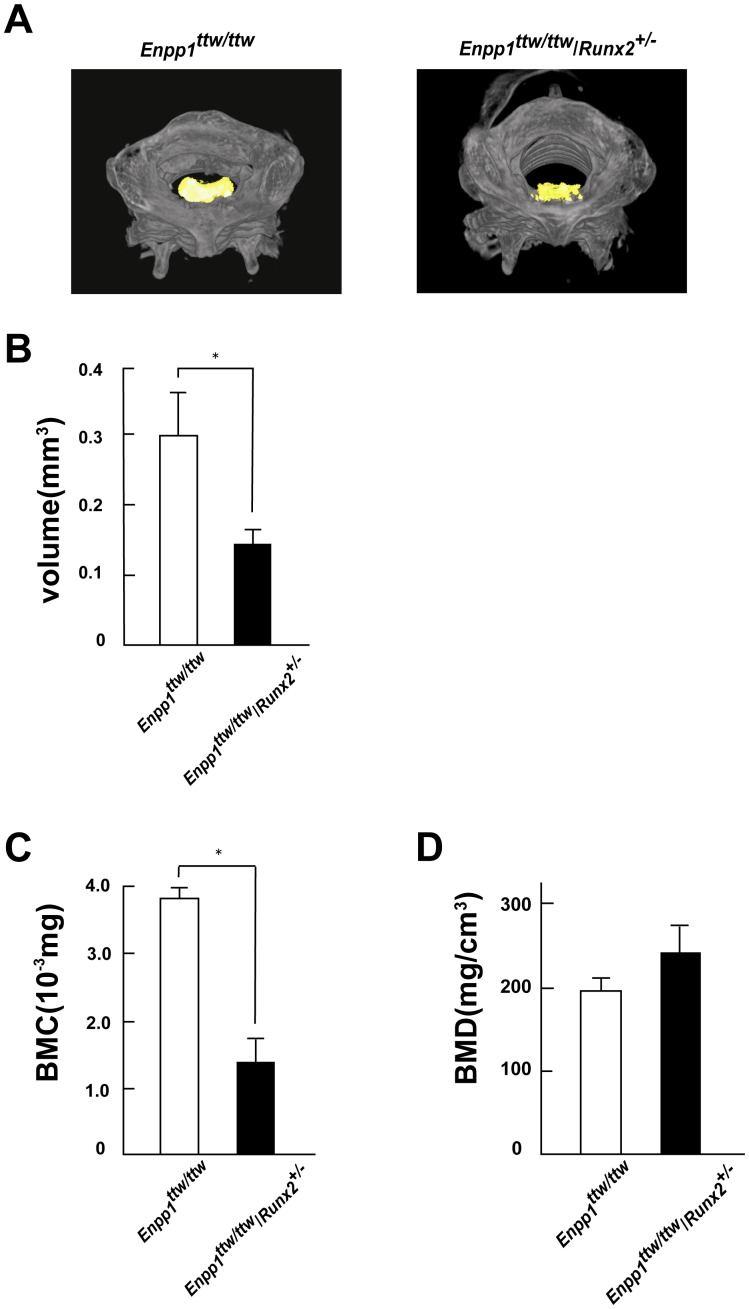
Figure 3. Quantitative analysis of ossification by micro-computed tomography (CT).
A, Micro-computed tomography of the cervical spine of Enpp1ttw/ttw mice at 12 weeks of age with or without Runx2 haploinsufficiency. 3D reconstructed images.Ectopically calcified region is shown in yellow. B, Quantitative analysis of the ossification of the cruciform ligament at the atlanto-occipital area using micro-CT in Enpp1ttw/ttw mice at 8 weeks of age with or without Runx2 haploinsufficiency. Note a significant decrease in calcified region in ENPP1ttw/ttw/Runx2+/− mice. C,D Micro-CT analysis of the ossification of the cruciform ligament at the atlanto-occipital area in Enpp1ttw/ttw mice at 12 weeks of age with or without Runx2 haploinsufficiency. Bone mineral content (C) Bone mineral density (D).

