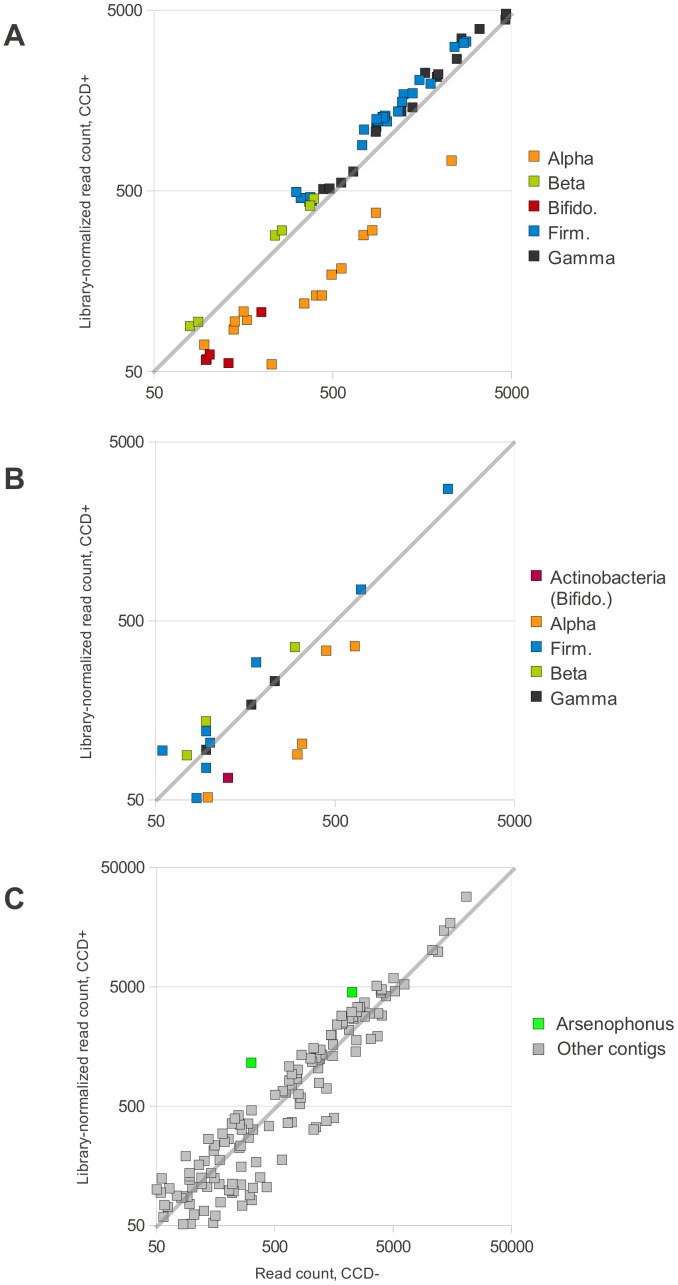
Figure 2. Change in abundance of bacterial taxa inferred from mapping of Illumina reads.
In all three panels, the horizontal axis is the number of reads mapping to each reference in the CCD− sample and the vertical axis is reads mapped in CCD+, adjusted for library size. The gray diagonal line in each panel demarcates equal representation in the two samples, and the axes are log10 scale. Only references with normalized read counts greater than 50 in each sample are displayed. A. Read counts for 72 GenBank accessions that are representative of the major gut microbial phylotypes of the honey bee. The accessions are drawn from Fig. S1 of [20] and are listed in Materials and Methods. Each accession is color-coded by taxonomy, following the phylotypes of [20]: Alpha = the alpha-proteobacteria clusters Alpha1, Alpha2.1, and Alpha2.2; Beta = beta-proteobacteria cluster, Gamma = the gamma-proteobacteria clusters Gamma1 and Gamma2, Bifido. = Bifidobacteria, and Firm. = the firmicutes clusters Firm4 and Firm5. B. Read counts of contigs in File S3 that were assigned to bacterial phyla using the Classifier tool [27]. All three actinobacteria contigs belonged to the genus Bifidobacteria based on high Classifier bootstrap support at the genus level (File S4) and best BLAST match (File S3). Other contigs are color-coded by phylum: Alpha = alpha-proteobacteria, Beta = beta-proteobacteria, Firm = firmicutes, and Gamma = gamma-proteobacteria. C. Read counts of all contigs with bacterial BLAST matches. A more diffuse but still bimodal distribution of relative change in read counts is apparent. The two contigs that show the greatest increase in CCD+ relative to other contigs (highlighted in green) both have best BLAST matches to the genus Arsenophonus with an expectation at least four orders of magnitude lower than the next closest taxon, but the maximum identity of these matches is only 90%.

