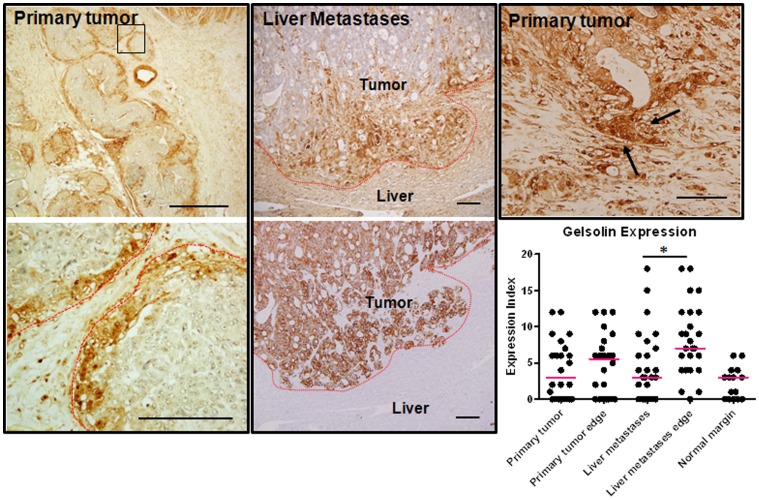
Figure 2. Gelsolin expression is prominent at the invasive front of human colorectal cancer tumors.
Gelsolin expression is high along the tumor periphery in primary tumors and liver metastases. The tumor periphery is outlined as red dotted line. A magnified view of a region of primary tumor edge (boxed) is shown on the bottom panel. The invading liver metastases shown are confirmed by cytokeratin stain, AE1/3, on an adjacent slide (bottom middle panel). Increased gelsolin expression was also detected in less-differentiated tumor cells which appeared to be breaking away from well-formed glandular structures (arrowed, top right panel). Gelsolin expression were scored and represented in the scatter dot plot (bottom). The median scores are represented by the red horizontal bars. Mann-whitney test was to compare the gelsolin expression score between the main tumor bulk and their periphery. Bar: 50 µm.

