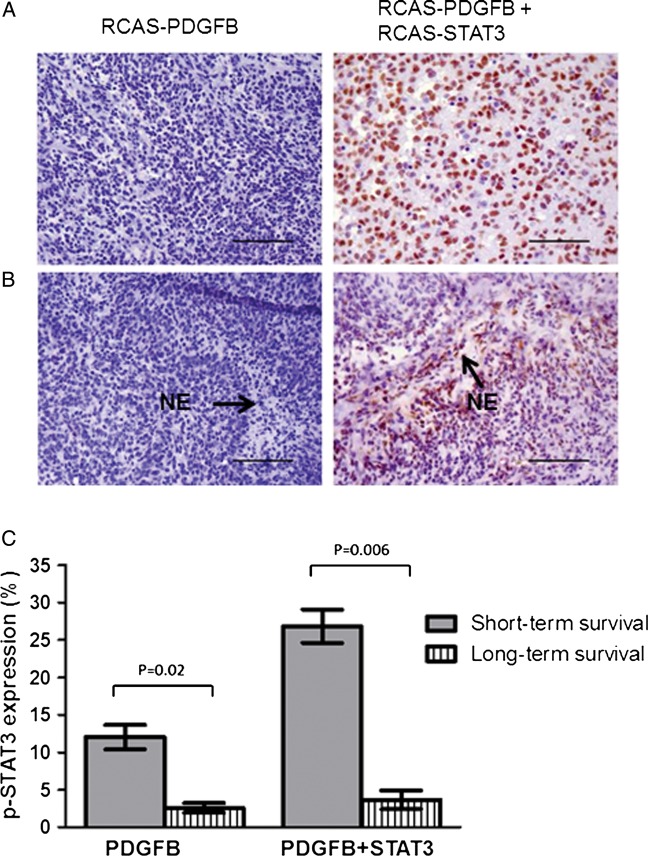
Fig. 3.
Expression of pSTAT3 is increased in tumors induced by RCAS-PDGFB + RCAS-STAT3 and pSTAT3-expressing cells appear to localize to areas of necrosis. (A) Photomicrograph (400× magnification) showing relatively minimal pSTAT3 expression in the nuclei within an HGG induced by RCAS-PDGFB compared with a tumor induced by RCAS-PDGFB + RCAS-STAT3 (scale bar = 50 µm). (B) Photomicrograph (400×) showing pSTAT3-expressing cells preferentially localizing to areas of necrosis (denoted as NE) in HGGs induced by RCAS-PDGFB + RCAS-STAT3 but not in the only HGG induced by RCAS-PDGFB alone that displayed necrosis (scale bar = 50 µm). (C) Percentage of cells expressing pSTAT3 in mice killed due to symptomatic tumor formation before the end of the 90-day observation period (labeled “short-term survival”) compared with those who survived to 90 days (labeled “long-term survival”) in RCAS-PDGFB (left) and RCAS-PDGFB + RCAS-STAT3 (right) injection sets. Error bars indicate SEM.

