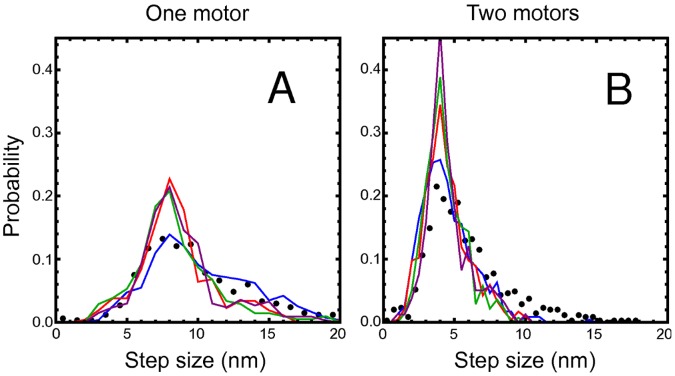
Figure 3. Normalized step size distributions for (A)  and (B)
  .
.
Experimental data from Ref. [1] shown as black point, simulation data as lines. Red line: Motor stalk that acts a linear spring (I) with zero rest length. Blue line: linear spring (II) with non-zero rest length. Green line: freely jointed chain (III). Purple line: worm-like chain (IV).

