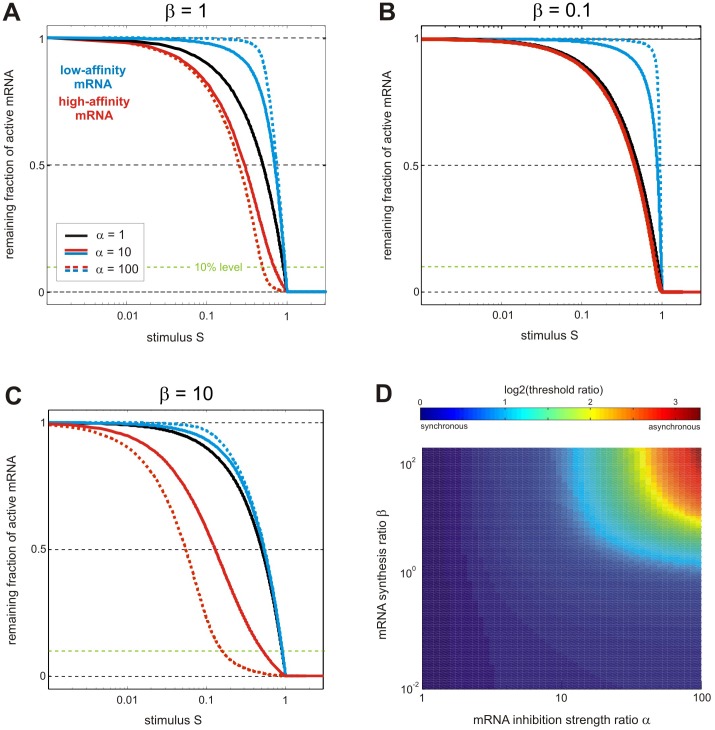
Figure 2. sRNA-mediated co-regulation can synchronize gene expression thresholds despite different affinities for individual mRNAs.
(A) Steady state dose-response curves of mRNA expression for equal synthesis rates of both mRNAs (β = 1). The remaining fraction of active mRNA species (Eq. 9) is shown as a function of the normalized sRNA synthesis rate (stimulus S; Eq. 8). The dose-response curves of the two mRNAs completely overlap if both mRNAs are inhibited with the same efficiency (α = 1; Eq. 6; black line), while they diverge for increasingly different inhibition strengths (α = 10; α = 100). According to Eq. 5, the system behavior is solely determined by the lumped parameters α and β. (B) and (C) Steady state dose-response curves of mRNA expression (same as in panel A) for unequal synthesis rates of both mRNAs (β = 0.1 or β = 10; cf. Eq. 4). (D) Gene expression threshold synchronization occurs over a broad range of kinetic parameters. The log2 threshold ratio (Eq. 10) was calculated for varying mRNA inhibition strength (α) and synthesis ratios (β) using Eq. 5. Thresholds were calculated using the 10% stimulus levels (S10, cf. horizontal green line in panels A–C), and divided to calculate the threshold ratio (Eq. 10). Blue areas in the heatmap reflect synchronous switching of both mRNAs.

