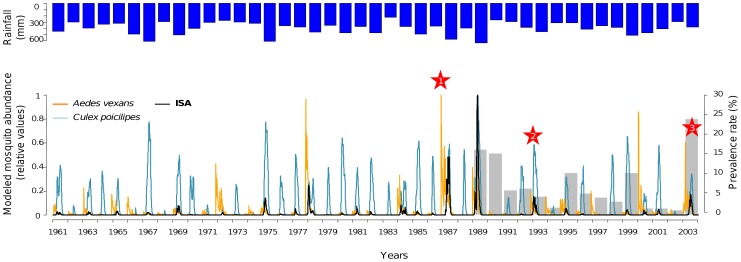
Figure 5. Modelled mosquito population dynamics, and Index of Simultaneous Abundance (ISA), Barkedji, Senegal, 1961–2003.
Total rainfall per year is represented in blue. Modelled Aedes vexans population dynamics are represented in orange, modelled Culex poicilipes population dynamics are represented in dark blue. Gray bars indicate prevalence rate in sentinel herd as reported by the RVF surveillance system [56]. Stars indicate years with reported RVF outbreaks in Northern Senegal and Southern Mauritania: 1) In 1987, the RVF epizootic led to an epidemic among humans exposed to diseased animals, where more than 200 human deaths were recorded together with many abortions in livestock [25]; 2) In 1993, an increase of seroprevalence rates in livestock along the Senegal River was recorded [26]; 3) In 2003, five RVF outbreaks were reported in the Senegal River valley by the national RVF surveillance network, and high seroconversion rates were reported in small ruminants in Barkedji, Ferlo region [28], [57].

