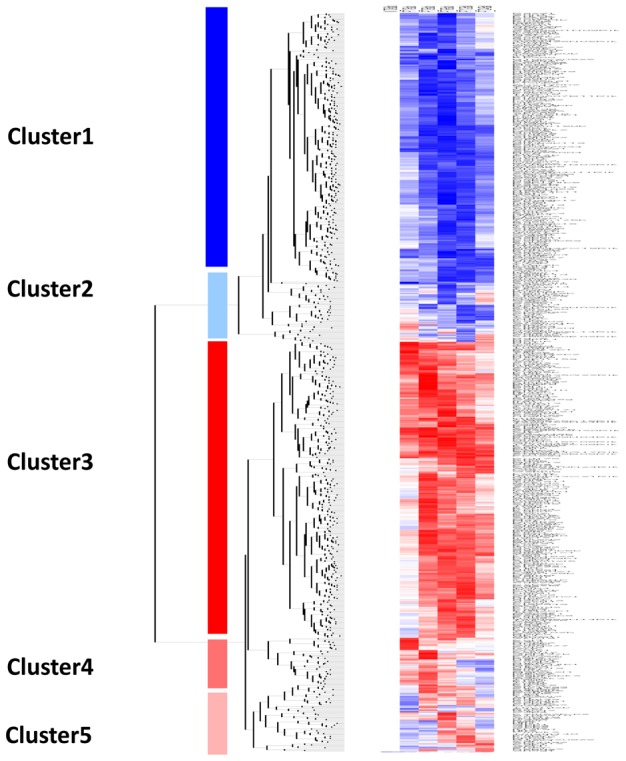
Figure 1. Hierarchical clustering of genes differentially expressed in Leishmania major infected BALB/c macrophages.

Five distinct clusters were identified by hierarchical clustering analysis using dChip software. Two clusters represent genes that were significantly down-regulated (cluster 1) and up-regulated (cluster 3) over the time course. The second (cluster 2), contains genes that start to be up-regulated from 6 to 24 hours after infection Two other clusters contain genes up-regulated during the early hours (1,3 and 6 hrs) of infection (cluster 4) and at 6, 12 and 24 hrs (cluster 5). Each row represents a spot on the microarray and each column a separate microarray. BMdM response was studied at five different time points (from the left to the right: P-T1h, P-T3h, P-T6h, P-T12h and P-T24h). The left-hand column show non-infected cells (NI) that were used as internal control.
