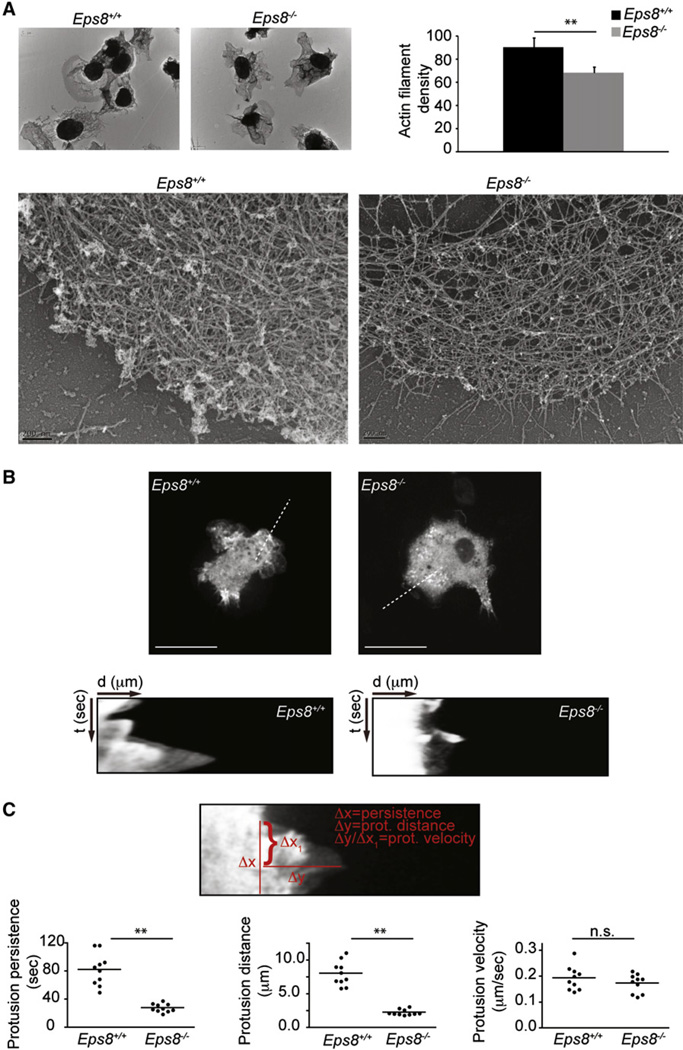
Figure 7. Eps8-Deficient BMDCs Display Reduced Density of the Lamellipodial Actin Meshwork and Reduced Protrusion Persistence.
(A) Eps8 deficiency causes a reduction in the actin filament meshwork density of BMDC protrusions. Platinum replica EM of lamellipodia of WT (Eps8+/+) and Eps8−/− (Eps8−/−) BMDCs plated as in Figure 6 was carried out as described in Svitkina and Borisy (1998). Low- (upper images) and high-magnification (lower images) representative images are shown. The scale bar of the lower images represents 200 nm. Actin filament density was determined as described in the Experimental Procedures. Data are expressed as mean ± SD (N = 75 areas from at least 15 cells/genotype); **p < 0.01.
(B and C) GFP-actin-infected, LPS-stimulated WT (Eps8+/+) and Eps8−/− (Eps8−/−) BMDCs were injected between a fetal bovine serum-coated, glass coverslip and a layer of agarose as described in Figure 6. Cells were induced to migrate toward a 2 mm afar attractor hole containing 1.2 µg/ml CCL19. BMDC migration was recorded by time-lapse microscopy. Still images from representative movies (Movie S6) of WT (Eps8+/+) and Eps8−/− (Eps8−/−) BMDCs are shown (B, top). Examples of kymographs performed on the indicated dotted lines (four to five different areas per cells of 10 different cells/genotype) are shown (B, bottom).
(C) Quantification of protrusion dynamics was carried out using kymograph image analysis software to determine protrusion persistence (Δx), distance (Δy), and velocity (Δy/Δx) as shown in the upper image (C). The distribution around the mean values of protrusion parameters of each of the ten cells/genotype is shown (C, lower panels); **p < 0.01., n.s., not significant.

