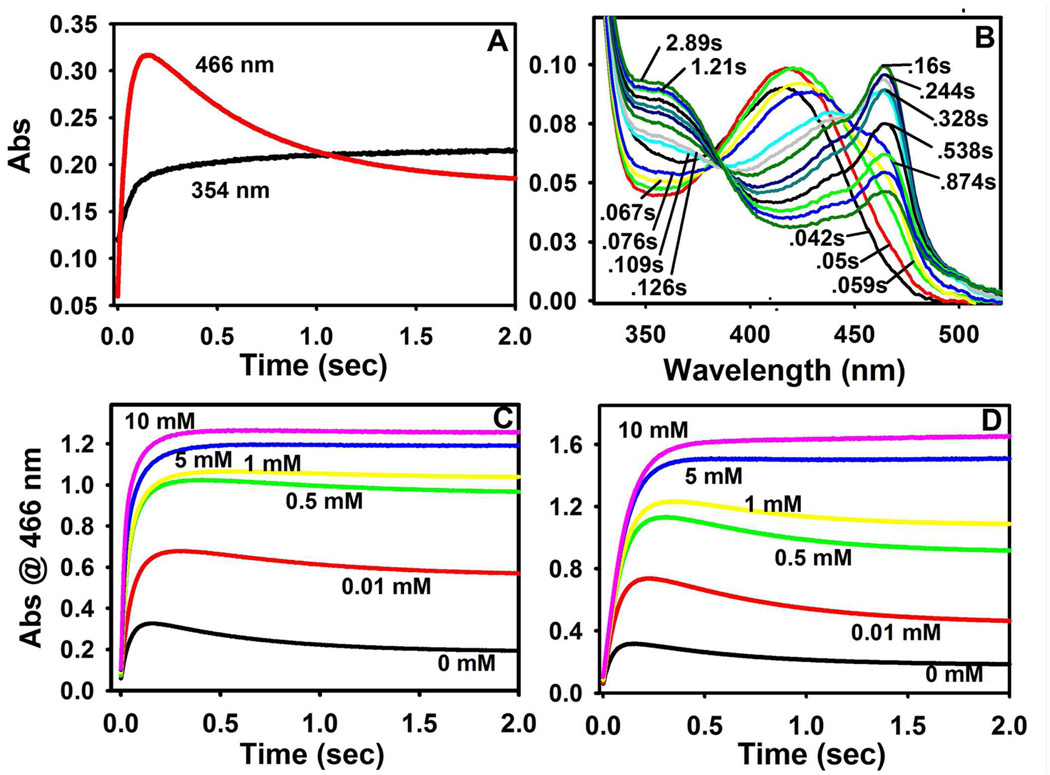
Figure 4.
(A) Comparison of the indoline reaction time courses at 466 nm and 354 nm under MVC-free conditions where L-Ser is mixed with 20 µM α2β2 preincubated with indoline in the SWSF. (B) Rapid-scanning stopped-flow experiment showing time-resolved spectra (300 to 550 nm) for the formation of E(Q)indoline under MVC-free conditions. L-Ser was mixed with MVC-free 10 µM α2β2 preincubated with indoline. Spectra were acquired at 0.042, 0.0504, 0.0588, 0.0672, 0.0756, 0.1092, 0.126, 0.1596, 0.2436, 0.3276, 0.5376, 0.8736, 1.21, 2.89 s following mixing. (C) and (D) Time courses at 466 nm for the reaction of L-Ser mixed in the SWSF apparatus with α2β2, indoline and different concentrations of CsCl (C) or NaCl (D). 50 mM L-Ser and 5 mM indoline were used in (A) – (D), and the indicated MVC concentrations were used in (C) and (D).

