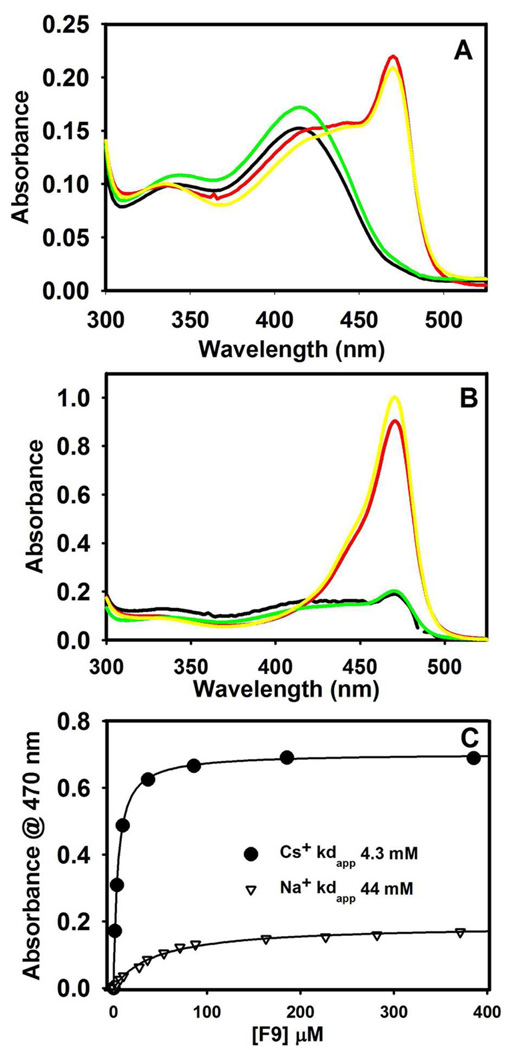
Figure 6.
Static spectra for the reactions of various MVC forms of α2β2 with L-His (eq 5) in the absence (A) and presence (B) of F9. MVC forms: Na+ (black), Cs+ (red), MVC-free (green), and NH4+ (yellow). (C) Binding isotherms measured at 470 nm for the titration of F9 into a premixed solution of α2β2, L-His and the Cs+ (black circles) or Na+ (open triangles). Each line is the least squares best fit of the data. Final Concentrations: 100 mM L-His, 50 mM MVC, and when present 200 µM F9; 10 mM α2β2 in (A) and (C), and 20 µM α2β2 in (B).

