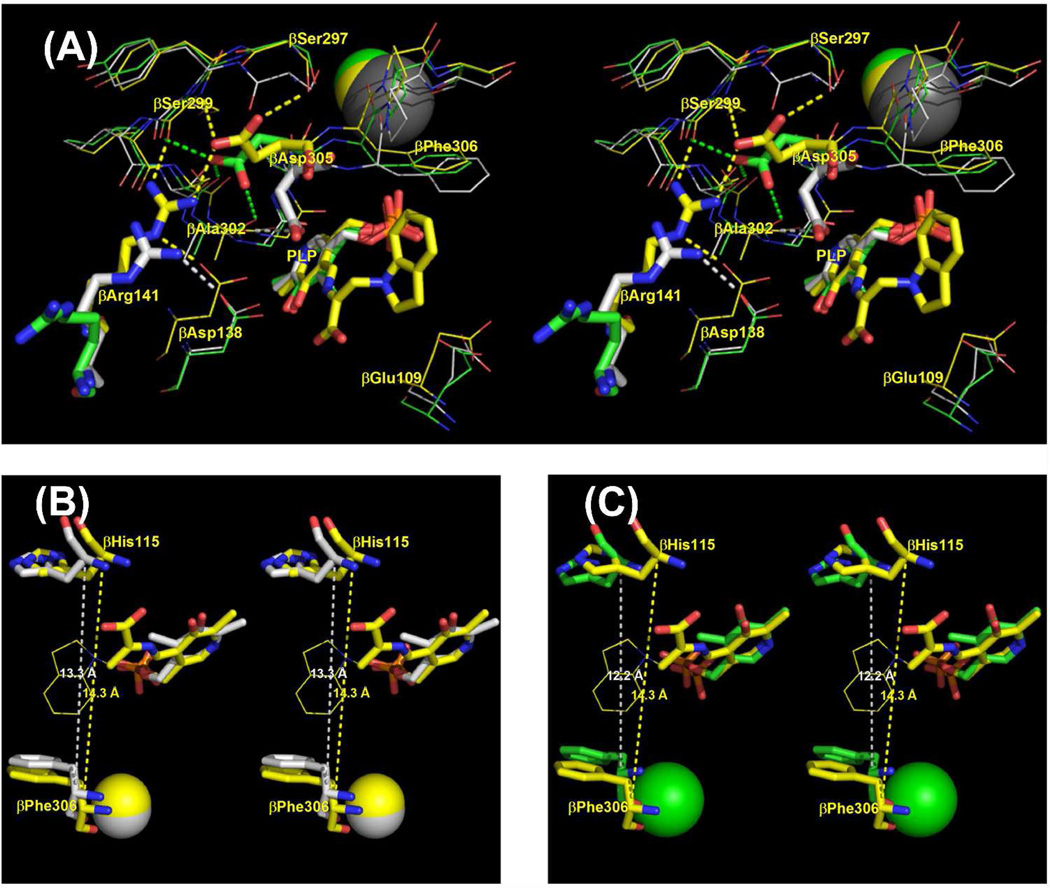
Figure 7.
(A) Stereoscopic diagram comparing details of the β-sites and MVC sites of the Na+-and Cs+-E(Ain) complexes (respectively, PDB codes 1KFK and 1TTP) with the Cs+ E(Q)indoline complex (PDB code 3CEP). The E(Ain) complexes have the open β-subunit conformation, the E(Q)indoline complex has the closed conformation. Structures were aligned using the Cα atom coordinates of β-subunit residues 10 to 100. Color scheme: PDB code 1KFK, carbons, Na+ and dashes are gray; PDB code 1TTP, carbons, Cs+ and dashes are green; PDB code 3CEP, carbons, Cs+ and dashes are yellow. All other atoms are shown in CPK colors. βAsp305, βArg141, and the PLP moieties are shown as sticks, other residues are shown as wireframe. Dashed lines indicate H-bonds and/or van der Waals contacts between the side chain of βAsp305, βArg141 and nearby residues. (B) and (C): Stereo views comparing the indole sub-sites of the open Cs+ and Na+ E(Ain) complexes, respectively, with the closed Cs+ E(Q)indoline complex. Coloring schemes: in (B) and (C), the C and Cs+ atoms are yellow in the Cs+ E(Q)indoline complex. In (B), the C and Cs+ atoms of the Cs+ E(Ain) complex are gray. In (C) the C and Na+ atoms of the Na+ E(Ain) complex are green. All other atoms are shown with CPK coloring. The indoline ring of the Cs+ E(Q)indoline complex is shown in wireframe. The dashed lines measure the distances between the Cα atoms of βHis115 and βPhe306. In (B) and (C), structures were superimposed using atoms of the PLP moieties and the MVC in the PyMOL paired selection mode. Structures rendered with PyMOL 1.1r1.

