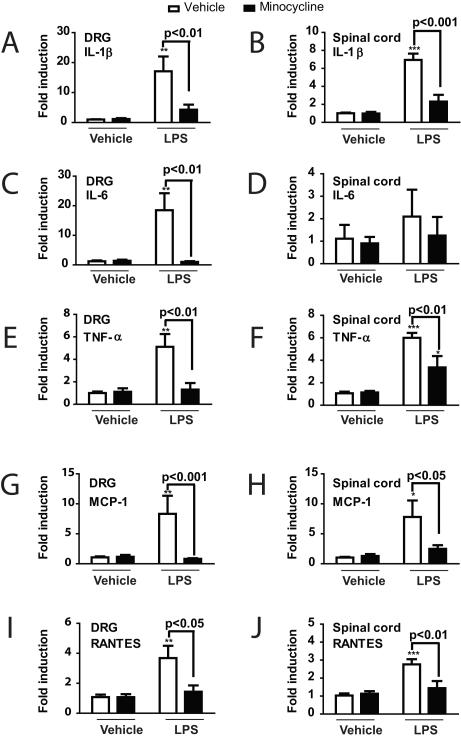
Fig. 6.
Graphs illustrating the effect of lipopolysaccharide (LPS) injection following 3 days of treatment with minocycline or vehicle (saline) on relative mRNA expression levels, expressed as a fold change compared with the control group values for (A, B) interleukin-1 beta (IL-1β), (C, D) interleukin-6 (IL-6), (E, F) tumor necrosis factor alpha (TNF-α), (G, H) monocyte chemotactic protein-1 (MCP-1), and (I, J) RANTES (regulated on activation, normal T expressed and secreted in (A, C, E, G, I) the dorsal root ganglion (DRG) and (B, D, F, H, J) the spinal cord. ***p < 0.001, ** p < 0.01 or *p < 0.05 versus the vehicle/vehicle control group.

