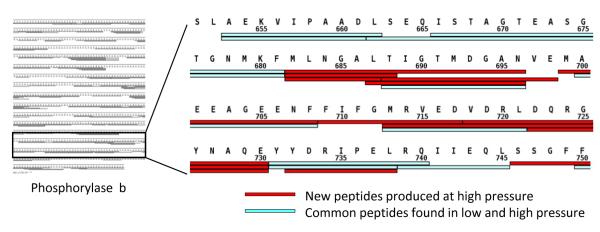
Figure 3.
Comparison of the map of peptic peptides from digestion of phosphorylase b under low- (950 psi) and high-pressure (9,800 psi) conditions. The left panel shows 83% coverage of phosphorylase b at 9,800 psi (see Supporting Information Figure S4 for the full map from the left panel). Part of the sequence map from residues 651-750 is shown in the right panel. The cyan bars indicate the peptic peptides found in both pressure conditions and the red bars indicate those new peptides found only with high-pressure digestion.

