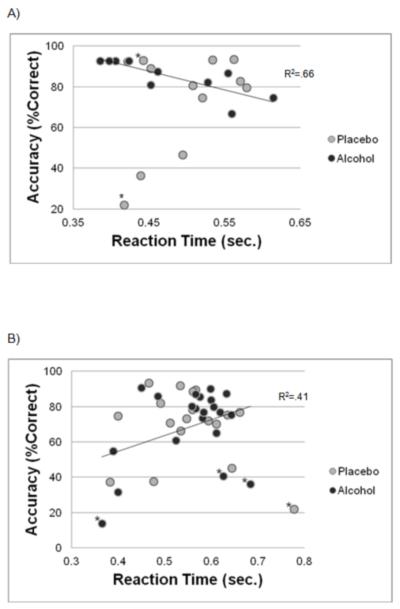
Figure 4.
Regression plots depicting the association between ACC and RT within the four experimental conditions. Asterisks (*) indicate outliers/highly influential observations which were excluded from the regression analysis depicted on the graphs (see Data Analysis). A) ACC and RT were not correlated among younger participants in the placebo condition (p>.1). ACC and RT, however, were negatively correlated in the active dose condition (p=.002). B) ACC and RT were not correlated among older participants who received a placebo dose (p>.6). However, these behavioral measures were significantly correlated in the active dose condition (p=.003).

