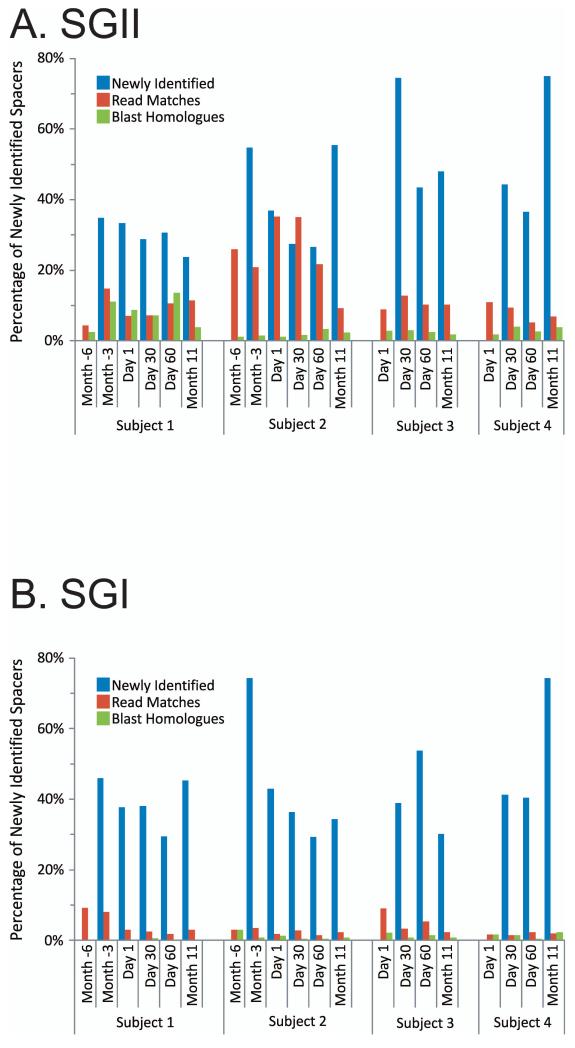
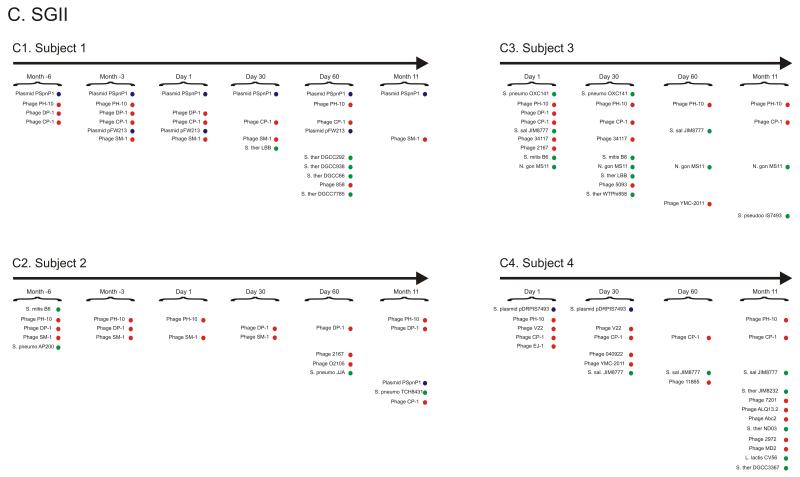
Figure 2.
Percentage of spacers (Panels A and B) and diagram of SGII CRISPR spacer homologous to various bacteria, phage, and plasmids (Panel C). The percentage of spacers in each subject and time point that were not identified at prior time points is demonstrated in blue. The percentage of those spacers that match virome reads is demonstrated in red, and the percentage of those spacers that have homologues in the NCBI NR database are shown in green. Panel A - SGII spacers and Panel B - SGI spacers. For the initial time point for each subject, homologues to CRISPR spacer complements are demonstrated in Panel C. At each subsequent time point, only homologues to newly identified spacers that were not present in prior time points are shown. For example, in subject #3 (Panel C3), spacers homologous to streptococcal phage PH-10 are identified on Day 1, while on Day 30 newly identified spacers that were not present on Day 1 also have homology to phage PH-10. Panel C1-Subject #1, Panel C2 - Subject #2, Panel C3 - Subject #3, and Panel C4 - Subject #4. Homologues to phage are shown in red, plasmids in blue, and bacteria in green.


