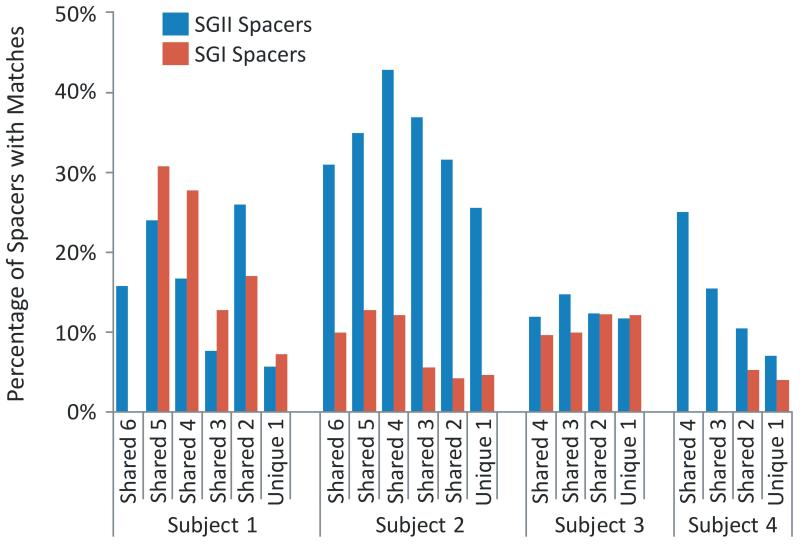
Figure 4.
Percentage of spacers with matches to virome reads in each subject. The percentage of spacers that are unique to individual time points and those that are shared between multiple time points are shown. The percentage of spacers with matches to reads in each virome is demonstrated on the Y axis.

