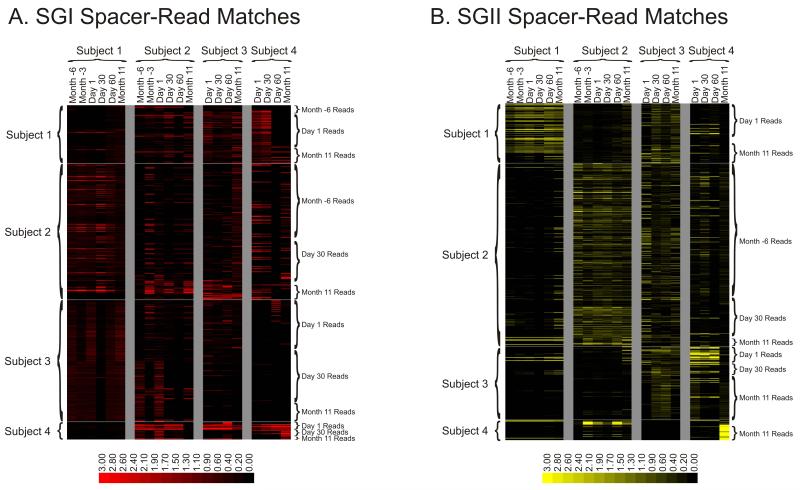
Figure 5.
Heatmap of virome reads with CRISPR spacer matches for SGI and SGII CRISPR spacers. Each row represents a unique virome read, and each column represents the CRISPR spacer repertoire found on that day for that subject. Reads from viromes of each subject are identified on the left of each diagram, and the day from which each read was recovered is shown on the right of each diagram. The intensity scale bar is shown below each panel, and its values correspond to the percentage of CRISPR spacer matches present in each subject and time point. Panel A – SGI CRISPR spacer-read matches, Panel B – SGII CRISPR spacer-read matches.

