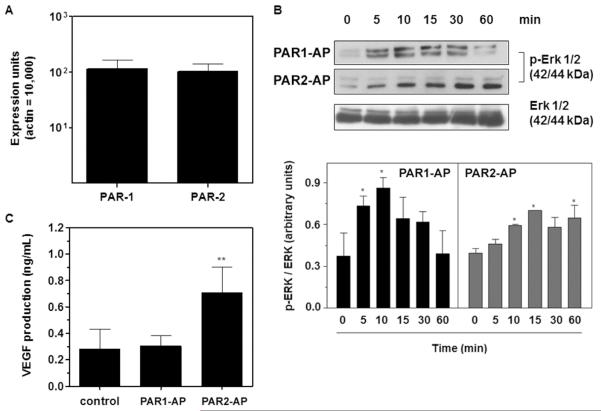
Figure 5. PAR2 but not PAR1 mediates VEGF production by B16F10 cells in vitro.
(A) Real-time PCR analysis of PAR1 and PAR2 gene expression in B16F10 cells. The assay was performed as described in the Methods section. Bars represent the mean ± SD of three independent experiments. (B) PAR1 and PAR2 mediate ERK 1/2 activation in B16F10 cells. B16F10 cells were serum-starved for 30 min and then treated with PAR1 (PAR1-AP, TFLLR-NH2, 50 μM) or PAR2 (PAR2-AP, SLIGKL-NH2, 50 μM) agonist peptides for different lengths of time. The levels of total and phosphorylated ERK 1/2 in the cell lysates were determined by immunoblotting, as described in the Methods section, and quantified by densitometry using the Scion Image software. Bars represent the mean ± SD of three independent experiments. Asterisks (*) indicate p<0.05 relative to time=0 min. (C) VEGF production by B16F10 cells mediated by PAR1 or PAR2 activation. The concentrations of VEGF in the supernatants of B16F10 cells cultured in the absence (control) or in the presence of PAR1 (PAR1-AP, TFLLR-NH2, 50 μM) or PAR2 (PAR2-AP, SLIGKL-NH2, 50 μM) agonist peptides for 24 h were assessed by ELISA. Bars represent the mean ± SD of three independent experiments. Asterisks (**) indicate p<0.01 relative to control.

