Figure 3.

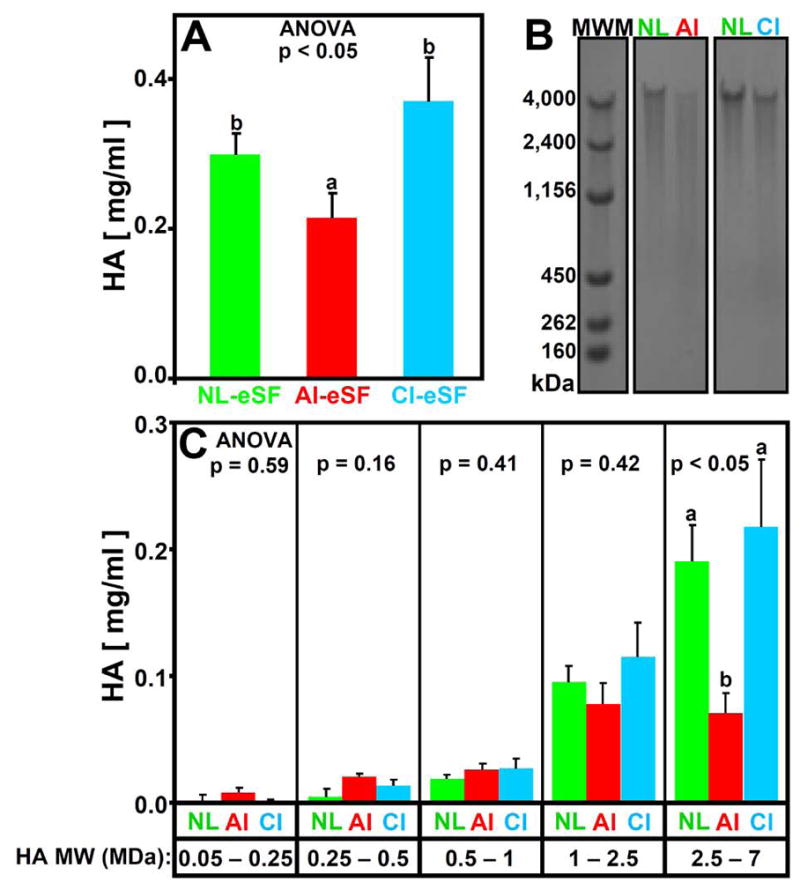
Effect of joint injury on hyaluronan (HA) (A) concentration (mg/ml) and (B, C) HA molecular weight (MW) distribution in NL-eSF (n = 19–20), AI-eSF (n = 10) and CI-eSF (n = 10). (B) Electrophoretic separation of typical samples. (C) Concentration of HA in 0.05 – 0.25, 0.25 – 0.5, 0.5 – 1, 1 – 2.5, and 2.5 – 7 MDa ranges. Data are mean ± SEM, and differing letters indicate significant differences between groups at p<0.05.
