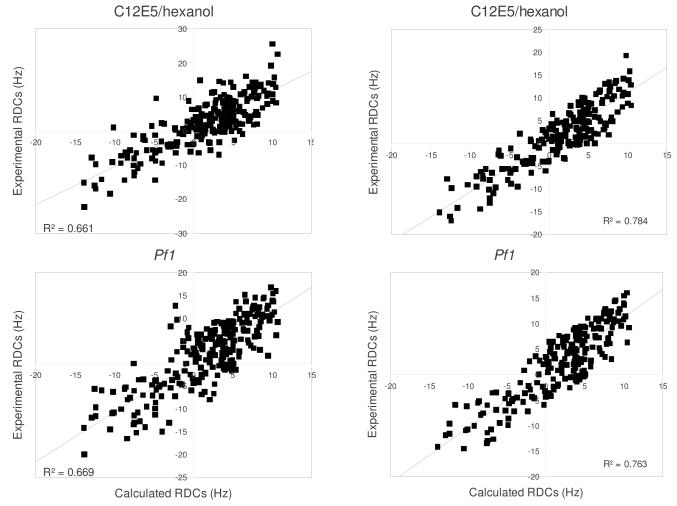
Figure 4.
Fitting of experimental RDCs versus RDC values calculated from MD simulations. Top left, fitting of all 228 RDCs measured in C12E5/hexanol medium used in MD simulations. Top right, fitting after removal of outliers with deviations > 6 Hz from calculated values (see text). All RDC values are in sec-1 (Hz). Bottom left, fitting of all 228 RDCs measured in Pf1 phage medium used in MD simulations. Bottom right, fitting after removal of outliers with deviations > 6 Hz from calculated values (see text).

