Figure 3.
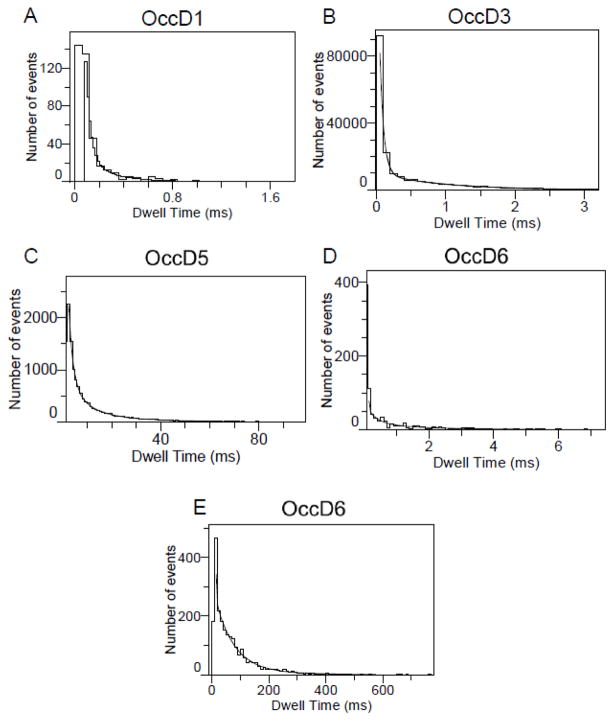
Standard dwell-time histograms of representative single-channel electrical traces fitted with exponential probability functions. Each of these histograms are only representative to one single-channel recording as the dwell time analysis across different experiments is not possible due to large variation of the dwell time behavior. OccD2 and OccD4 exhibited irresolvable dwell times. The fits were based upon log likelihood ratio (LLR) tests with a given confidence level of 0.95 [s27; 54; 55]. The results of the fits were the following: (A) OccD1, τO2 = 0.11 ± 0.02 ms; (B) OccD3, τO1-1 = 0.06 ± 0.01 ms and τO1-2 = 0.92 ± 0.04 ms; (C) OccD5, τO2-1 = 4.2 ± 0.3 ms, τO2-2 = 15.3 ± 0.7 ms; (D) OccD6 τO1-1 = 0.12 ± 0.01 ms and τO1-2 = 1.9 ± 0.2 ms. OccD6 has two major open sub-states O1and O2. The O2 open sub-state featured downward current spikes to the O1 open sub-state; (E) OccD6, τO2-1 = 4.6 ± 0.5 ms, τO2-2 = 81.5 ms ± 3.8 ms. The OccD2 channel exhibited irresolvable current sub-states. OccD4 also showed very low-amplitude, short-lived and irresolvable current spikes.

