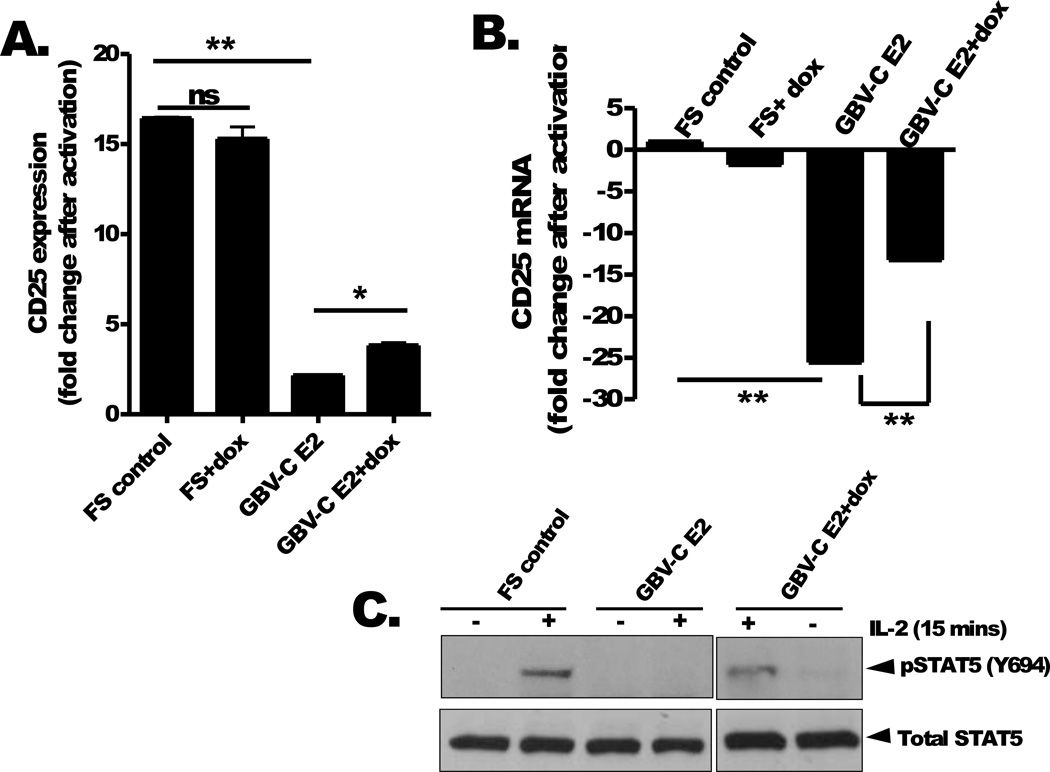
Figure 3. GBV-C E2 protein reduces IL-2Rα expression and STAT5 phosphorylation.
Cell surface expression of the IL-2α receptor (CD25) on Jurkat cells expressing GBV-C E2 (1–331) or the frameshift control (FS) following T cell receptor activation (anti-CD3/CD28) was measured by flow cytometry. The fold increase in CD25 expression was calculated by measuring mean fluorescence intensity before and after stimulation. CD25 mRNA levels in Jurkat cell lines following TCR activation (B). GBV-C E2 and FS cells were maintained with or without doxycycline for 5 days (dox; 1 µg/mL) (B). Total and phosphorylated STAT5 expression following incubation with IL-2 (see methods for details) in FS and E2 expressing Jurkat cells maintained with and without dox for 5 days (C). *P <0.01; **P <0.001

