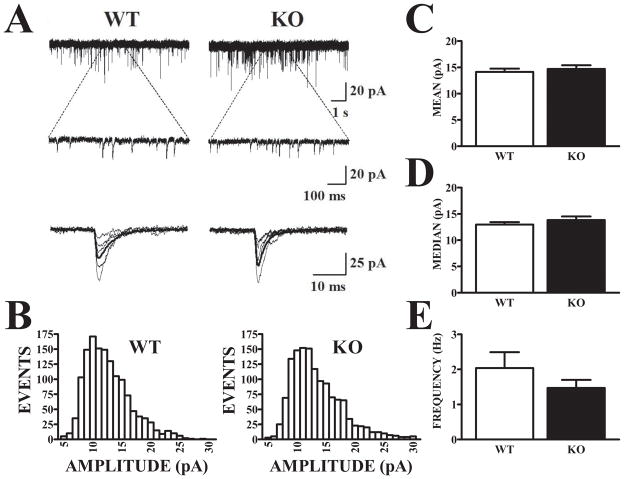
Figure 3. Amplitude and frequency of AMPA receptor-mediated mEPSCs do not differ in APC of Fmr1-KO and WT mice.
A. AMPA-mediated mEPSCs were recorded in the presence of the NMDA antagonist, CPP, and the sodium channel antagonist, TTX. Recordings show spontaneously-occurring currents from representative WT and Fmr1-KO mice at slow (upper) and expanded (lower) sweeps, with captured individual events temporally aligned and superimposed below. B. Amplitude histograms of captured events exceeding detection threshold (5 pA) are displayed for the same two cells illustrated in (A). Distributions of mEPSCs from the WT and Fmr1-KO cells were equally skewed and exhibited no evident differences. Histograms are based on events recorded during a 400 sec period in each cell. C–D. Mean mEPSC amplitudes were compared for WT (n = 10) and Fmr1-KO (n = 17) cells. Since amplitude histograms were skewed, “average” amplitudes across cells within each group were calculated based on either the mean (C) or median (D) amplitude for each cell. Neither measure showed a significant difference between genotypes (t-tests, p>.05) E. The average mEPSC frequency observed was also not significantly different (t25 = 1.25, p>.2).

