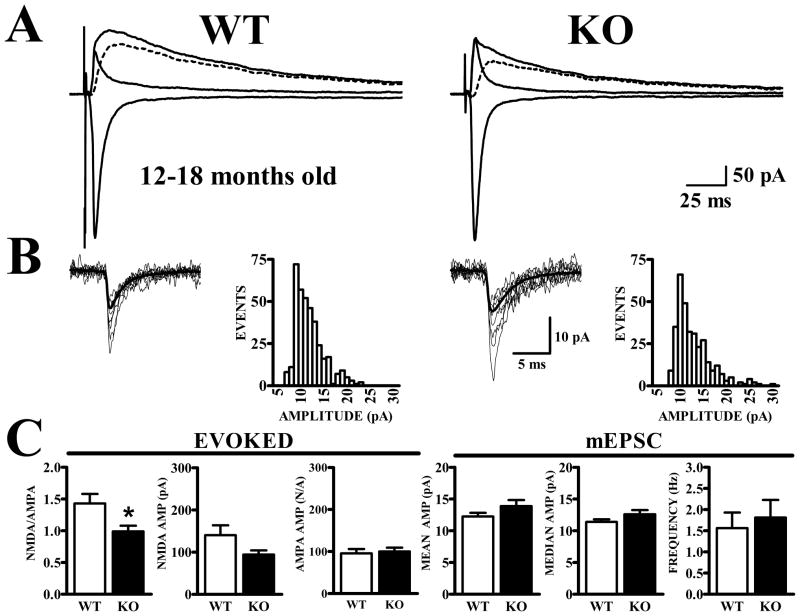
Figure 7. Lower NMDA/AMPA ratio is maintained in Fmr1-KO mice at 12–18 months of age.
A. Traces show synaptic currents recorded at −80 mV before and at +40 mV before and after CPP, along with the subtracted NMDA current (dashed traces). B. mEPSCs exhibit similar amplitude distributions in WT and Fmr1-KO mice. C. Bar graphs show quantification of NMDA and AMPA currents for evoked synaptic currents (left panels) and mEPSCs (right panels). NMDA/AMPA ratios were significantly lower in cells from Fmr1-KO mice (t28 = 2.59, p<.05) and the average NMDA current was lower; however this difference did not reach significance (t28 = 1.87, p=.072). AMPA currents obtained from WT and Fmr1-KO mice were nearly identical. Measurements of AMPA receptor-mediated mEPSC amplitude and frequency did not distinguish between cells from either genotype.

