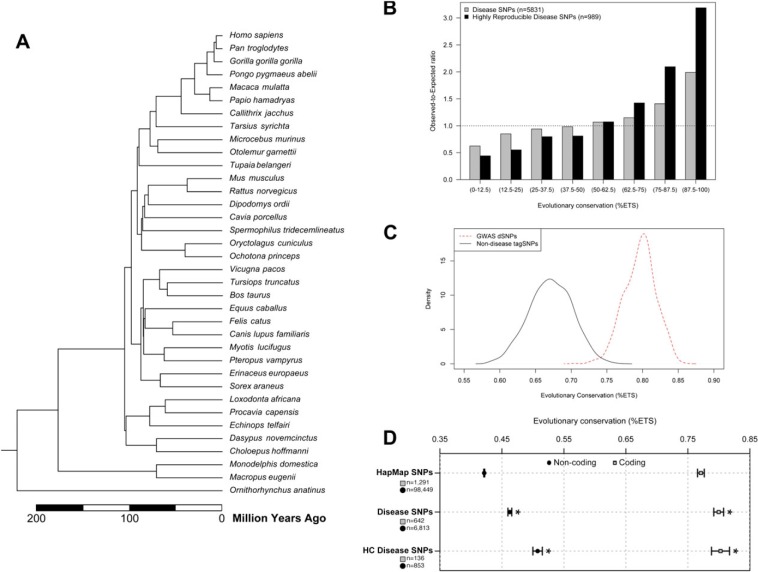
FIG. 1.
Patterns of evolutionary conservation of positions harboring disease-associated SNPs. (A) A time tree of 36 mammalian species used for deriving evolutionary information for each SNP. Species divergence times were obtained from www.timetree.org (Hedges et al. 2006). (B) Relationship of the observed-to-expected numbers of disease-associated SNPs, dSNPs, at human genomic positions preserved with different degrees over time (high-to-low is given left-to-right). Results from all dSNPs (gray bars) and high-confidence (HC) dSNPs (black bars) are shown. Expected numbers were estimated using HapMap3 SNPs. The right axis indicates the fraction of total SNPs in each dSNP category that fall into the conservation bins defined on the bottom axis. (C) The distribution of evolutionary conservation for GWAS dSNPs associated at a stringent significance threshold of P < 5 × 10⁻⁷ or lower in two or more studies (red, dashed) is compared with the distribution of evolutionary conservation of 100,000 randomly selected tagSNPs chosen from two of the most popular GWAS genotyping platforms (black). The mean evolutionary conservation for GWAS dSNPs is significantly higher than that of tagSNPs (t-test P < 5 × 10⁻²⁰). (D) Comparison of average conservation of coding (gray squares) and noncoding (circles) dSNPs and HC dSNPs to HapMap3 SNPs. The HapMap3 distributions are estimated from a representative random sample of 100,000 HapMap3 SNP loci. As expected, coding dSNPs occur at more highly conserved positions than noncoding dSNPs, but the trend toward more conserved positions at disease-associated loci is observed in both cases. SNPs in noncoding regions are overall found at much less conserved positions, however, the mean conservation for noncoding is significantly more conserved than noncoding HapMap SNPs (error bars: standard error of mean) (* indicates t-test P value < 10−8 compared with HapMap3).

