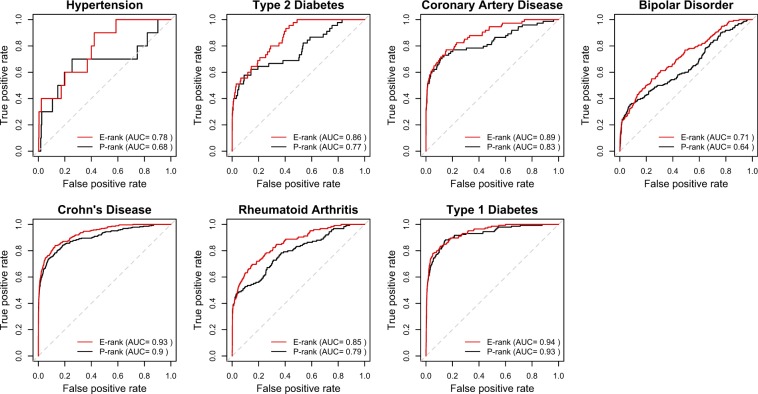
FIG. 4.
Evolutionary adjustment improves discriminatory power to identify reproducible associations. ROC curves representing the accuracy, represented by the AUC, to predict associations subsequently replicated in three or more independent association studies are shown for each of the seven disease association studies represented in the Wellcome Trust Case Control Consortium (WTCCC) data. The black line indicates the predictive accuracy of the original allelic association P values estimated by comparison of cases versus controls in the WTCCC study (P-rank). The red line indicates the predictive accuracy after prioritizing SNP loci using the E-rank approach. The gray diagonal line represents random performance (AUC = 0.5).

