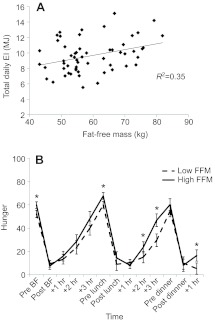
Fig. 1.
Relationship between FFM, daily EI and daily profile of hunger. (A) Scatter plot shows the relationship between FFM and daily EI in a group of 41 overweight or obese men and women. The regression is significant (P<0.001). The values represent the average values from objective measures taken at specific probe days at weeks 0, 6 and 12. (B) Daily hunger profiles for individuals with the highest FFMs (eight women and five men) and those with the lowest FFMs (eight women and five men). The groups were formed by dividing the whole sample into tertiles of FFM and comparing the upper and lower tertiles (but keeping similar numbers of men and women in each tertile). The difference between the area under the curve for the two profiles is significant (P<0.01); asterisks indicate time points at which the profiles are significantly different. The profiles indicate that hunger in the high FFM group is greater before the onset of a meal and in the period leading up to the meal, but not at the end of the meal. This is consistent with the fact that the high FFM individuals eat a larger meal, which would return hunger to a level appropriate for full satiation. Together, data displayed in A and B indicate that FFM is positively associated with daily EI and with daily hunger levels. Additionally, because RMR is highly and significantly correlated with FFM, the relationships between RMR, EI and hunger very closely match those for FFM shown in the figure. Data derived from studies reported by Blundell et al. (Blundell et al., 2012). BF, breakfast. Hunger is measured in units on a 100 unit scale on the screen of a hand-held PDA.

