Fig. 3.
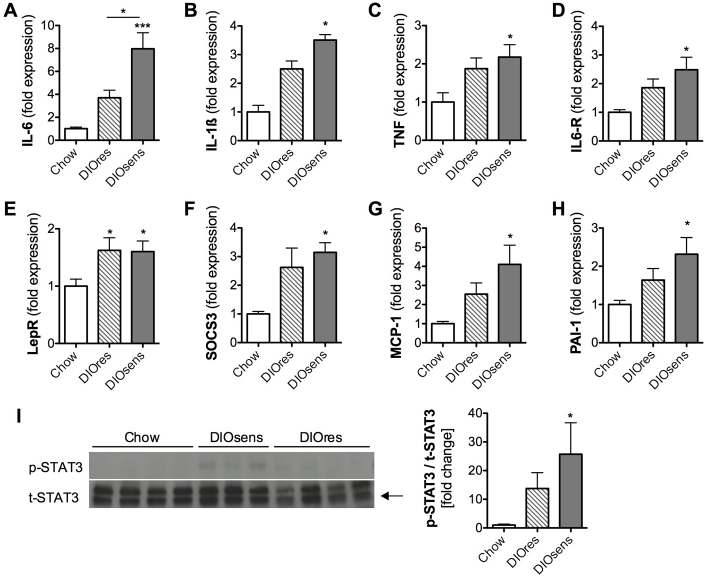
Increased renal inflammation and STAT3 signaling in DIO rats. (A-H) Relative gene expression levels normalized to the geometric average of the respective housekeeping gene hypoxanthine guanine phosphoribosyl transferase 1 (HPRT1). (A) Interleukin 6 (IL-6), (B) interleukin 1β (IL-1β), (C) tumor necrosis factor-α (TNF), (D) interleukin 6 receptor (IL6-R), (E) leptin receptor (Lep-R), (F) suppressor of cytokine signaling 3 (SOCS3), (G) monocyte chemotactic protein-1 (MCP-1), (H) plasminogen activator inhibitor-1 (PAI-1). (I) Representative western blot (n=3–4) and densitometric analysis (n=7–8) of phosphorylated STAT3 (p-STAT3) and total STAT (t-STAT3). The ratio of p-STAT3 to t-STAT3 from DIOres and DIOsens rats was normalized to the ratio derived from chow-fed controls (defined as onefold change). All values are given as means ± s.e.m. Significant differences were analyzed by using one-way ANOVA and Bonferroni multiple comparison post tests and indicated as *P<0.05 and ***P<0.001 vs chow controls.

