
Fig. 3.
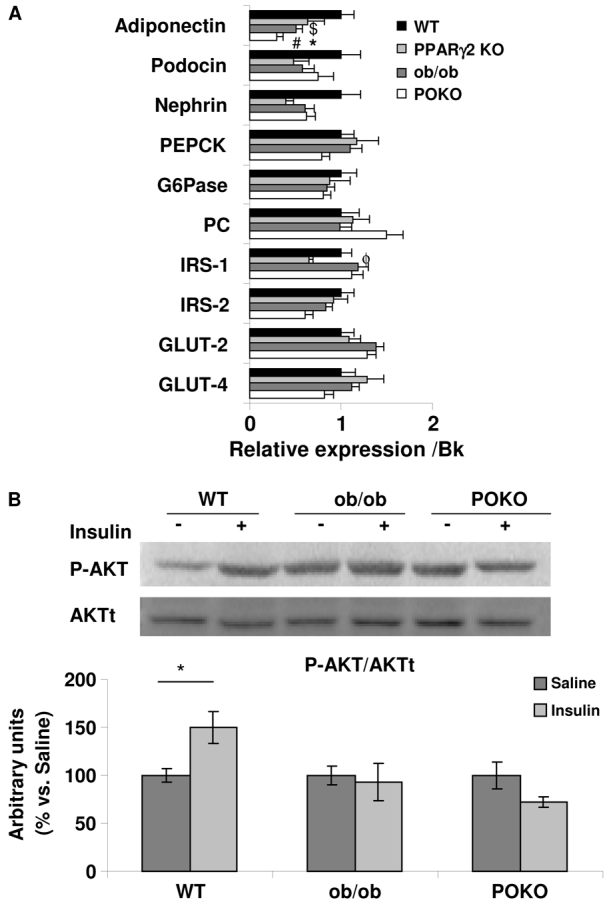
Insulin resistance in POKO kidneys. (A) Total kidney mRNA levels of glucose metabolism genes from 4-week-old male WT, PPARγ2 KO, ob/ob and POKO mice. Data are means±s.e.m.; n=8–9. *P<0.05 POKO vs ob/ob; #P<0.05 POKO vs WT; $P<0.05 ob/ob vs WT; ϕP<0.05 PPARγ2 KO vs WT. Normalized levels with BestKeeper (Bk). (B) Representative immunoblot for pAKT(Ser473) from WT, ob/ob and POKO 4-week-old-male mice treated and non treated with insulin. Levels were normalized to total protein kinase B (AKTt). Each value is the relative optical intensity of each band normalized as a percentage of the saline-treated group. Values are represented in graphic (n=5–8). Data are means±s.e.m. *P<0.05 WT saline vs WT insulin. G6Pase, glucose 6-phosphatase; PEPCK, phosphoenolpyruvate carboxykinase; IRS, insulin receptor substrate.