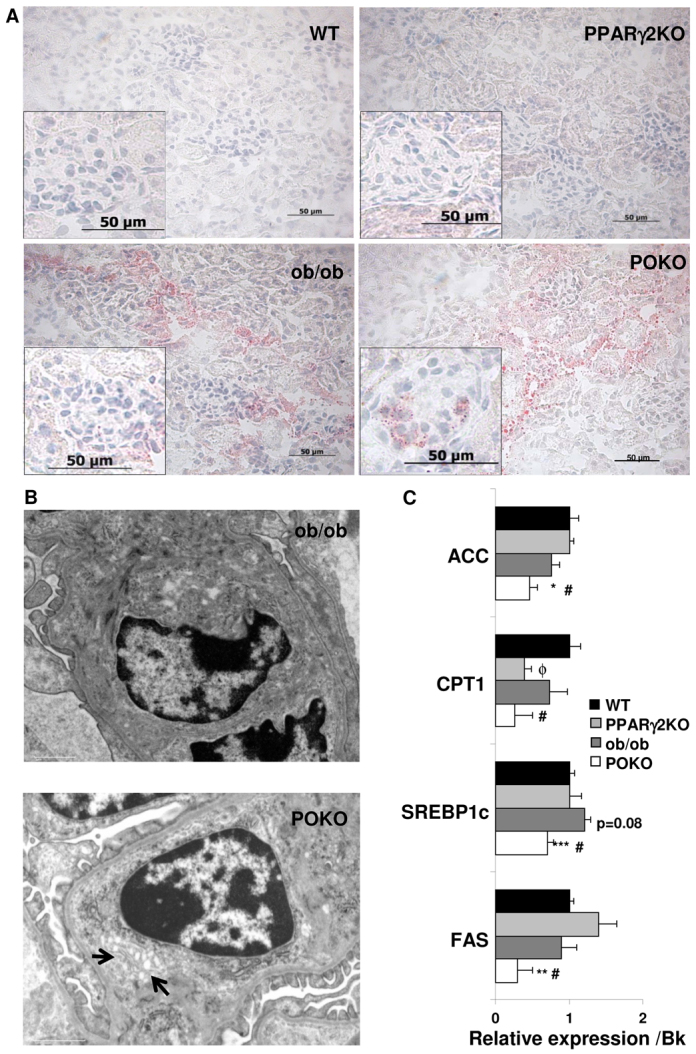
Fig. 4.

Altered lipid metabolism in POKO kidneys. (A) Representative Oil-Red-O staining in the kidney from WT, PPARγ2 KO, ob/ob and POKO mice at 4 weeks. Original magnification: 400× (n=4). (B) Intraglomerular electron micrographs of ob/ob mice (12,000×) and POKO mice (15,000×) showing accumulation of lipid droplets (arrows). (C) Total kidney mRNA levels of lipid metabolism genes from 4-week-old male WT, PPARγ2 KO, ob/ob and POKO mice. Data are means±s.e.m.; n=8–9. *P<0.05, **P<0.01, ***P<0.001 POKO vs ob/ob; #P<0.05 POKO vs WT; ϕP<0.05 PPARγ2 KO vs WT. Normalized levels with BestKeeper (Bk).
