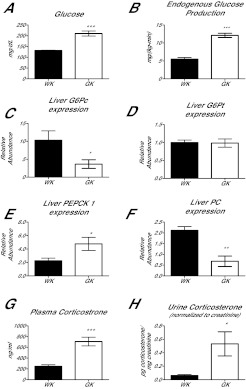
Fig. 1.
Comparison between WK and GK rats after an overnight fast. (A) Fasting plasma glucose concentration. (B) Endogenous glucose production. (C–F) Expression of gluconeogenic enzymes. (G) Fasting plasma corticosterone. (H) 24-hour urine corticosterone normalized to creatinine. *P<0.05, **P<0.01, ***P<0.001. n=7–10/group.

