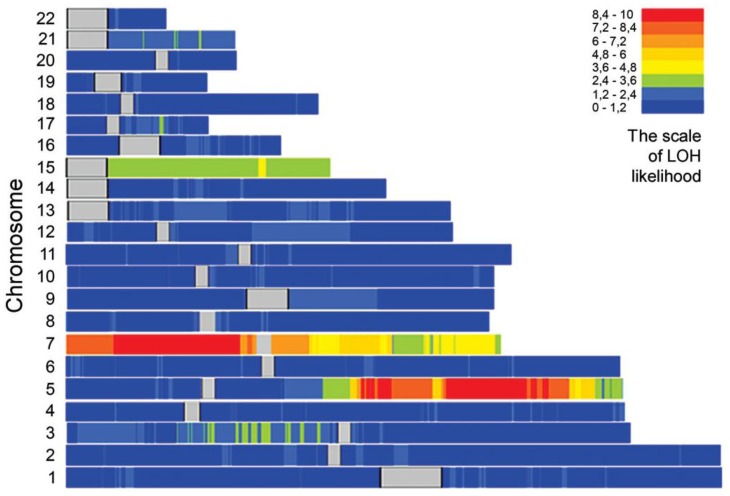
Figure 1.
The pattern of genome-wide LOH score derived by SNP arrays in set of 19 radiation-associated AML samples. The average of LOH-likelihood values ranges from blue (lowest probability) to red (highest probability). Centromeres are indicated with grey. The high LOH-score at chromosome 15 was due to homozygosity along the entire chromosome in a single case.

