Figure 3.
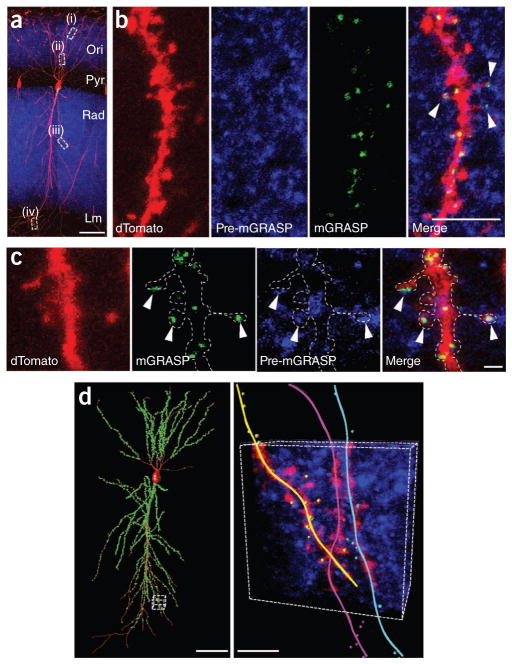
Reconstitution of mGRASP in hippocampal CA3-CA1 connectivity. (a) Discrete puncta of reconstituted mGRASP fluorescence in one CA1 neuron in Supplementary Figure 3. Ori, stratum oriens; pyr, stratum pyramidale; rad, stratum radiatum; and lm, stratum lacunosummoleculare. Scale bar, 100 μm. (b,c) Cropped high-magnification images of dendrites (dashed boxes (i) in b, (ii) in c and (iii) and (vi) in Supplementary Fig. 3) with reconstituted mGRASP signals in the spine heads in which blue axons intersected with red dendrites (arrowheads). Scale bars, 5 μm (b) and 1 μm (c). (d) An example of reconstructed dTomato-labeled CA1 neurons; locations of synapses were automatically detected in three dimensions following steps 1–3 in Supplementary Figure 5 (left). Cropped image illustrating synapse detection (colored spheres) in dendritic branches (right). Scale bars, 500 μm (left) and 4 μm (right).

