Figure 4.
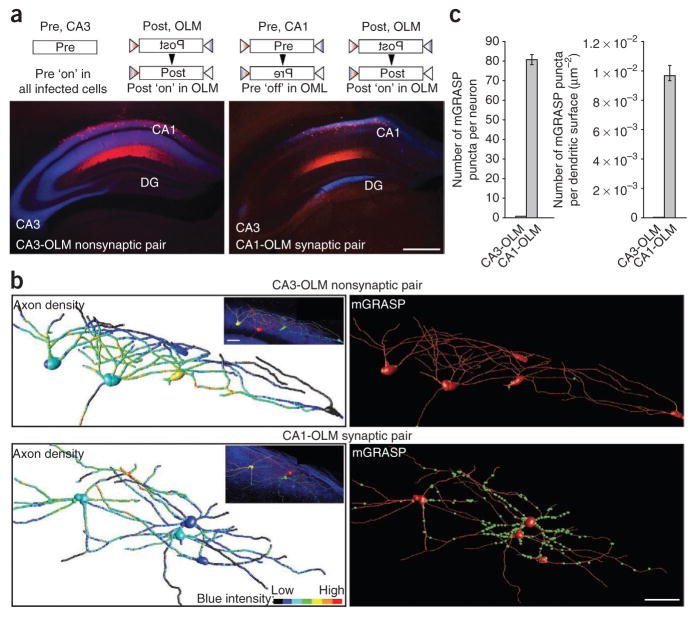
mGRASP detects actual synapses with high specificity. (a) For a nonsynaptic pair (CA3-OLM), unconditional pre-mGRASP and Cre recombinase–dependent ‘switch-on’ post-mGRASP constructs were injected into CA3 and CA1 of the sst-Cre mouse, separately. For a synaptic pair (CA1-OLM), both Cre recombinase–dependent ‘switch-off’ pre-mGRASP and ‘switch-on’ post-mGRASP were injected into CA1 of the sst-Cre mouse. dTomato and mCerulean fluorescence merged images show blue axonal projections from CA3 and CA1, and post-mGRASP expression in OLM cells. In the merged image of a synaptic pair, blue axons of a small fraction of granule cells were additionally detected but the usual pattern of exclusive CA1 axonal projections is shown in Supplementary Figure 2. Scale bar, 500 μm. (b) Low to high axon density of CA3 and CA1 surrounding post-mGRASP–expressing OLM cells presented in a color-coded reconstruction; insets indicate locations of OLM cells along with axonal projections (left). mGRASP puncta detected in CA1-OLM as compared to CA3-OLM (right). Scale bars, 50 μm. (c) Quantification of mGRASP detections per cell (0.989 ± 0.169 mGRASP puncta, n = 61 cells from 3 mice for CA3-OLM and 80.383 ± 4.992 mGRASP puncta, n = 65 cells from 3 mice for CA1-OLM: mGRASP density per dendritic surface area; 6.05 × 10⁻⁵ μm2 ± 0.82 × 10⁻⁵ μm2, n = 5 stitched image stacks from three mice for CA3-OLM and 9.6 × 10⁻³ μm2 ± 1.05 × 10⁻³ μm2, n = 5 stitched image stacks from three mice for CA1-OLM). Error bars, s.e.m.

