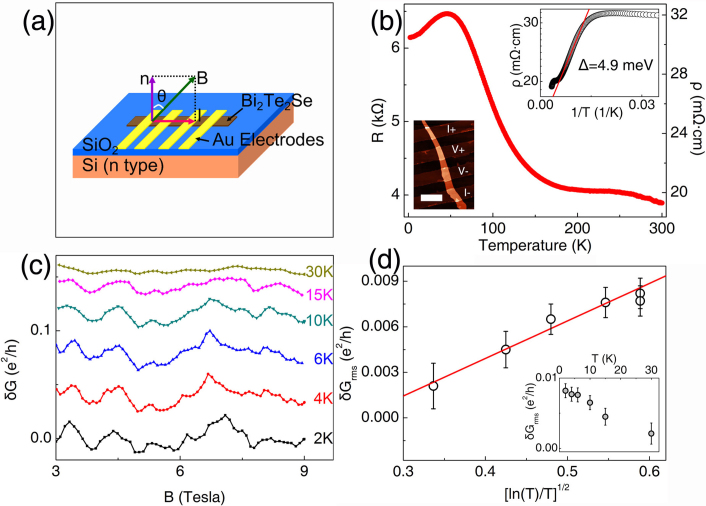
Figure 1. The UCF and its temperature dependence.
(a) the schematic diagram of the measurement configuration. (b) Temperature dependence of the resistance and resistivity of a Bi2Te2Se microflake. The left inset shows its AFM image with the scale bar of 4 μm. The right inset shows the Arrhenius fitting of ρ(T) with the result of a 4.9 meV band gap. (c) Conductance fluctuations plotted against B at various temperatures (θ = 0). The aperiodic δG-B patterns appear repeatedly. For clarity, adjacent curves are displaced vertically. (d) δGrms and its temperature dependence. The inset shows the data in a linear scale. The solid curve is fit by the traditional UCF theory.

